-
Notifications
You must be signed in to change notification settings - Fork 368
Log aggregation overview
Deepak Narayana Rao edited this page Oct 16, 2017
·
8 revisions
- ELK: Log Aggregation
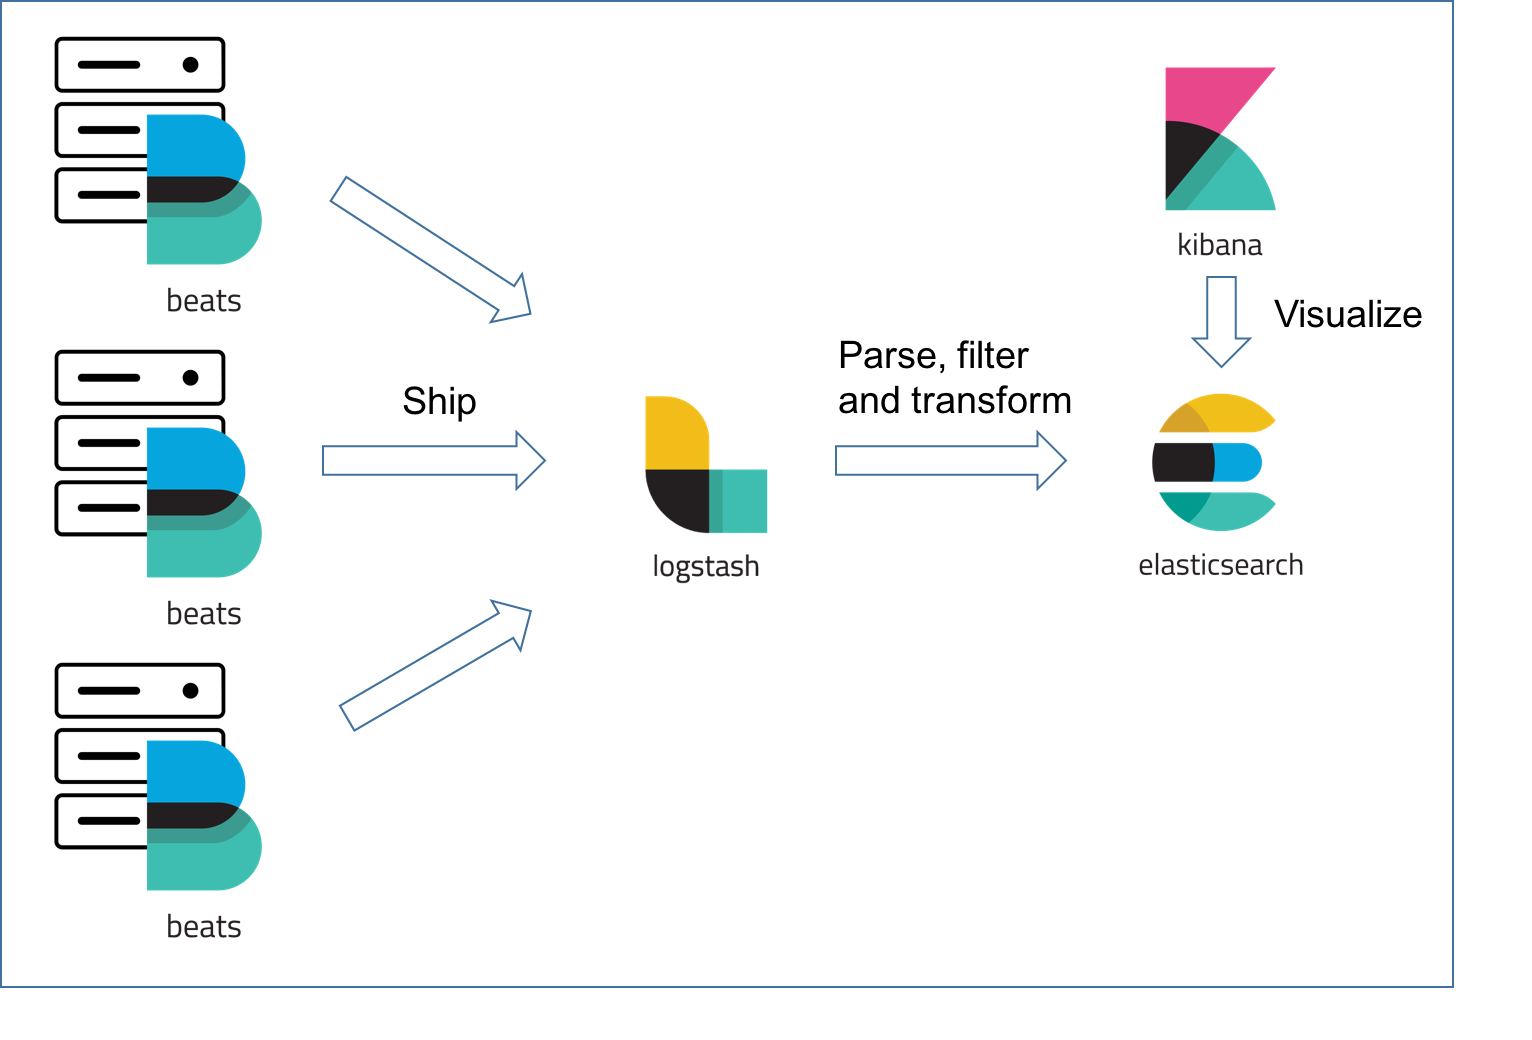
- Elasticsearch : Log storage and search APIs
- Logstash: Transforms logs into structured data to be stored in elsticsearch
- Kibana: UI to search logs and visualise data
- Logspout: Ship logs from containers
- Filebeat: Ship logs from VMs
- Oauth proxy: Google auth for accessing kibana
Please try this simple walkthrough tutorial to get hands on experience on log aggregation https://botleg.com/stories/log-management-of-docker-swarm-with-elk-stack/

Image : Edit Link
- Logstash is run as a service inside the docker swarm
- Logstash service is run with syslog input plugin which enables logstash to acts as syslog server
- Logstash's syslog port is published in swarm and this available on swarm worker nodes. There is a internal TCP load balancer for all the worker nodes. This load balancer exposes logstash to services outside the swarm
- Logspout is run on all worker nodes by deploying it as [global replication mode] service (https://docs.docker.com/engine/swarm/how-swarm-mode-works/services/#replicated-and-global-services) in docker swarm
- Logspout container on each server communicates to docker engine using docker APIs and fetches logs from all containers running on its host server
Note:
docker service logsordocker logsreturns logs written tostdoutandstderr. Hence all the services / containers running inside docker swarm should have logs written tostdoutfor informational logs andstderrfor error logs
- Logspout pushes the logs to Logstash using syslog protocol. Example config
syslog+tcp://logger_logstash:51415 - Logstash parses logs to structure the data and pushes the structured logs to elasticsearch

Image Source: https://jujucharms.com/u/lazypower/logspout/
- Services running outside the swarm (stateful service like databases) should have logs directed to
/var/syslog - Filebeat installed on all servers is configured to fetch logs from
/var/syslogand push to logstash - Logstash parses logs to structure the data and pushes the structured logs to elasticsearch

Image Source: https://logz.io/blog/filebeat-vs-logstash/