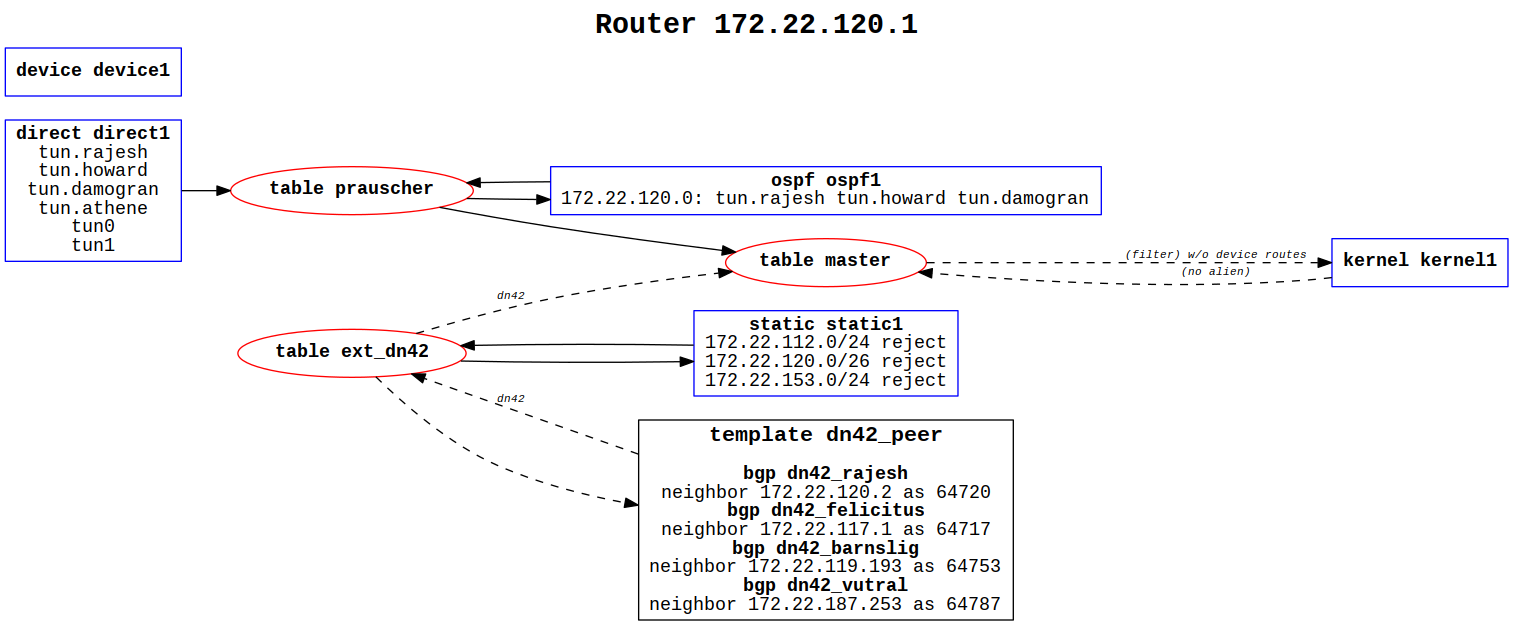
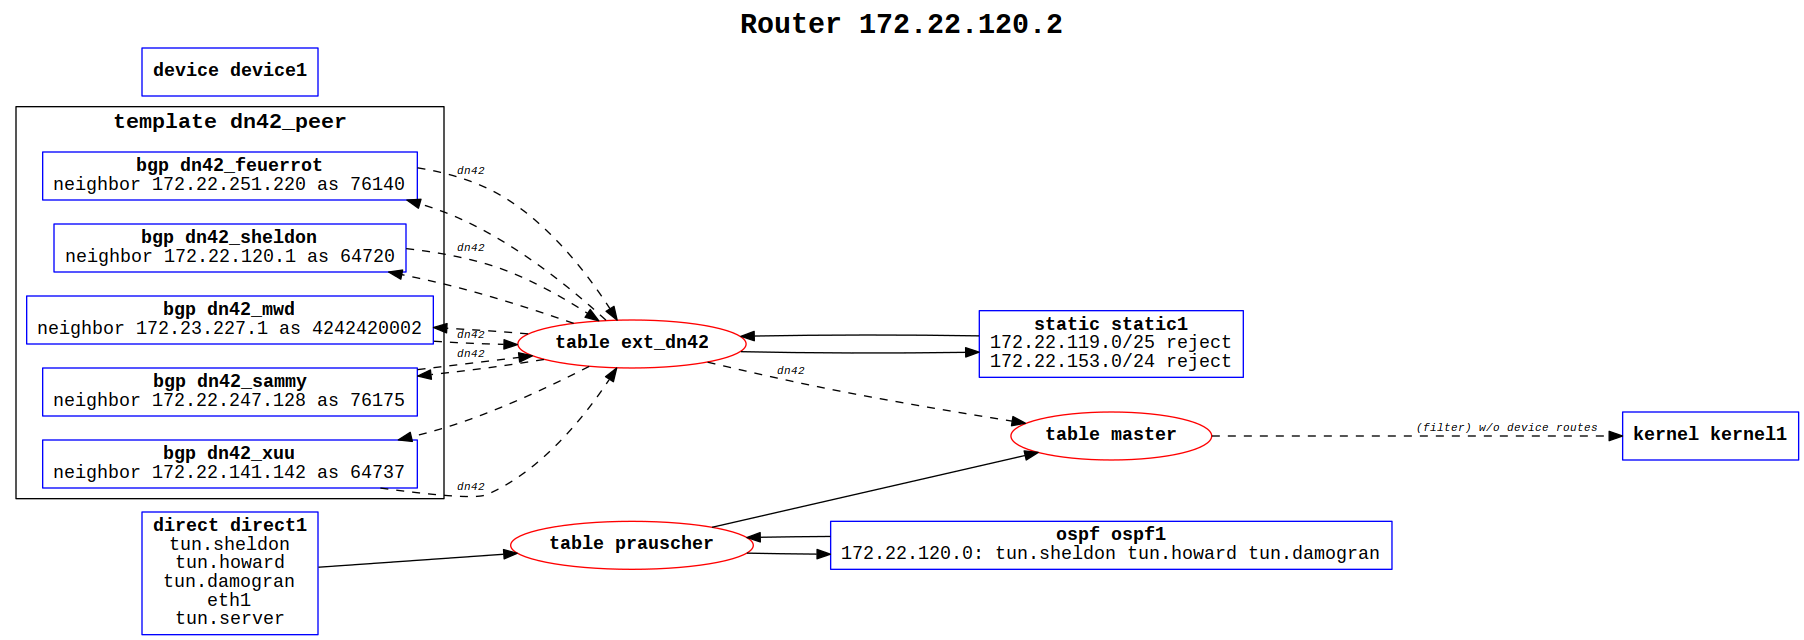
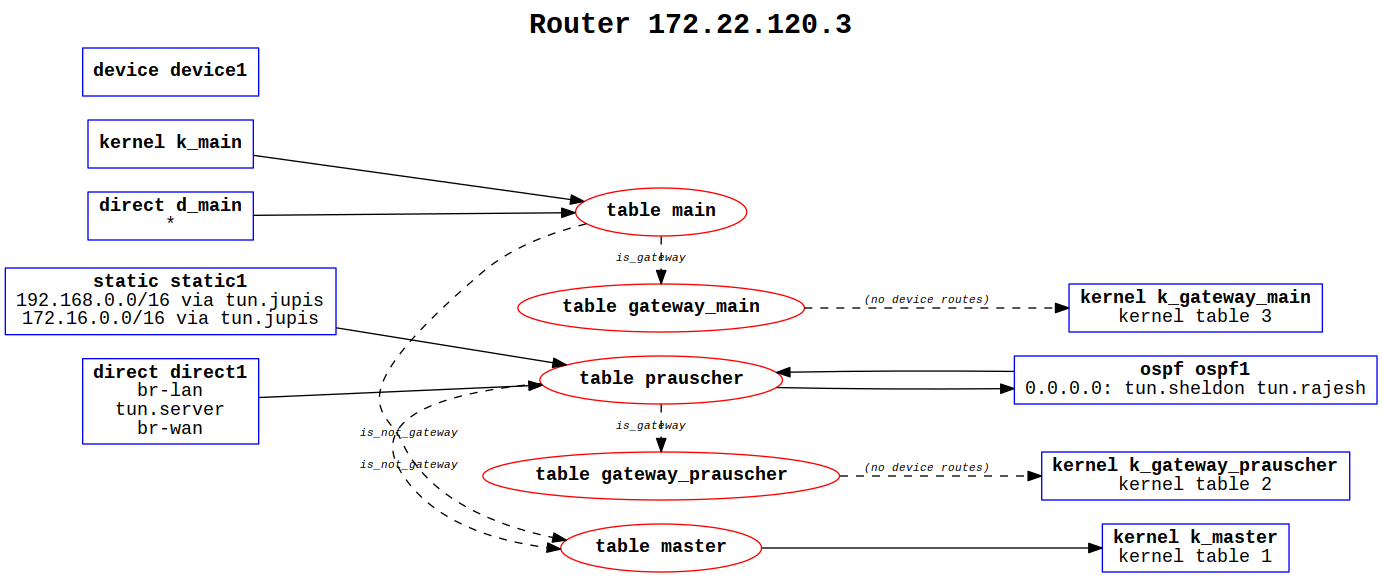
This small scripts will analyze your bird configuration and give you a graphical overview what way routes may take in your setup.
Please note that it uses a self-written python-parser, which may not guess all configurations correctly. Feel free to send issues or pull-requests!
To generate your graph, simply run birdviz.py and give it your config-file as argument. It will give you dot-language which you can turn into png/svg/... using dot.
E.g: python3 birdviz.py examples/howard.conf | dot -Tsvg > examples/howard.svg will give you a svg-graph in example/howard.svg.
Examples of my routers can be found in the examples-folder


