This project will be sunset in January 2024
Please do not introduce it into your environment.
Please see #344
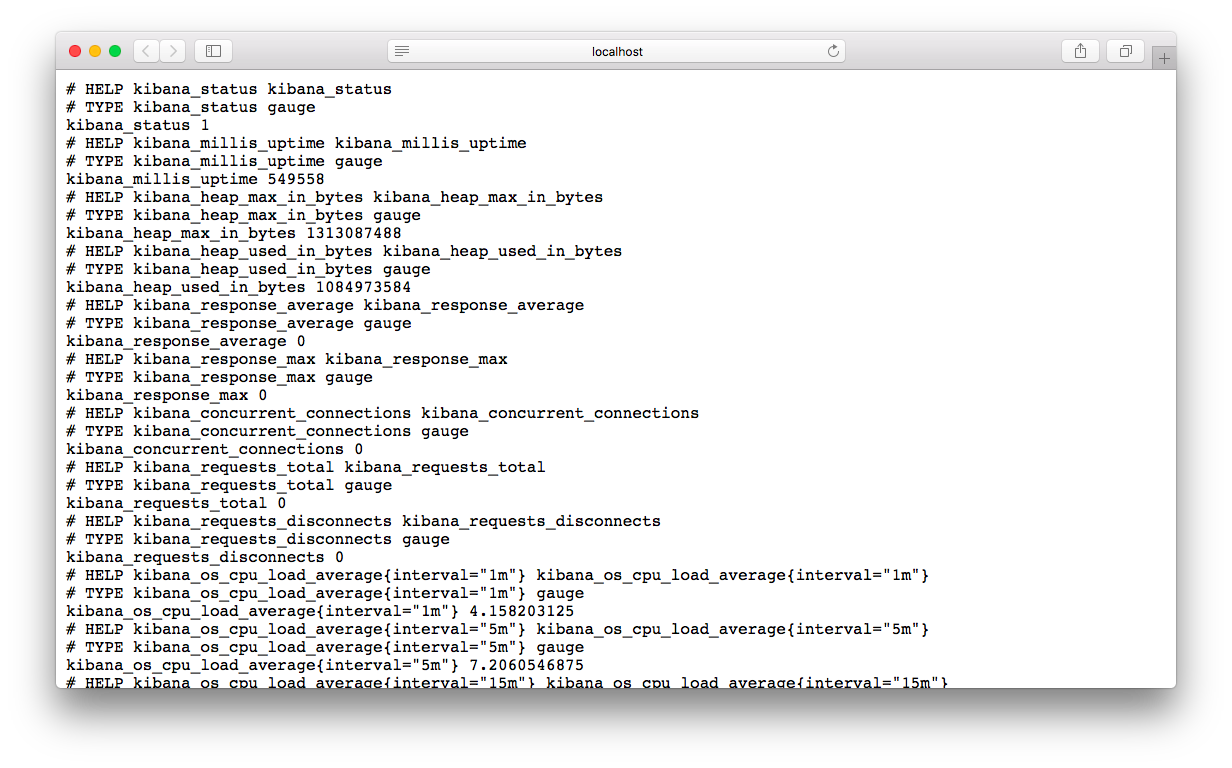
Once Installed, please visit http://localhost:5601/_prometheus/metrics
First, locate the version you require on the release page. There is a couple of ways to install this plugin. The more common approach would be to download the correct version and run:
bin/kibana-plugin install https://github.com/pjhampton/kibana-prometheus-exporter/releases/download/8.10.0/kibana-prometheus-exporter-8.10.0.zip
Important: Please don't build off and install from the trunk (master). This is a development / experimental branch so don't be that girl/them/guy, please. The RELEASE/{NUM} branches are the release branches. This process is shaped by the Kibana release process.
You can install into your container with the following command (replace, or env set ${KIBANA_VERSION}):
RUN bin/kibana-plugin install https://github.com/pjhampton/kibana-prometheus-exporter/releases/download/${KIBANA_VERSION}/kibana-prometheus-exporter-${KIBANA_VERSION}.zip
Below is an example prometheus config.
- job_name: 'kibana'
  scrape_interval: '10s'
  metrics_path: '_prometheus/metrics'
  static_configs:
  - targets: ['localhost:5601']
  basic_auth:
    username: 'elastic'
    password: 'changeme'
Details on the various exported metrics are documented on the Github wiki page.
The version of this plugin must match the version of Kibana you are running. Click here to download the available versions. If you don't see the version you want, please feel free to open an issue to request.
For releases older than 8.0.0 please see: RELEASES.md


