Under Pressure is a lightweight application to facilitate monitoring of the drift gas pressures related to the Agilent G6560X IM-QTOF.
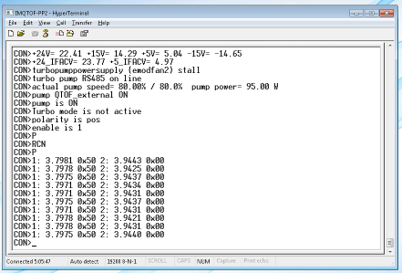
The current method of monitoring and adjusting drift gas pressures can be a little hit and miss. A Hyperterminal connection is made and the stream of data in the Hyperterminal window is eyeballed.
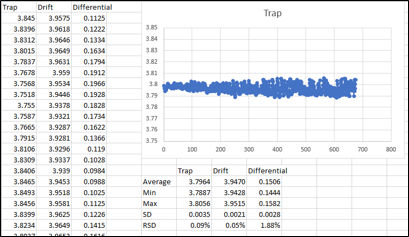
More exact measurements can be performed by taking the data offline and exporting to CSV followed by manually parsing the data and creating the statistics or graphs as required.
This is labour intensive and does not allow for an online live view resulting in an iterative process of adjusting and checking.
In response to this and to alleviate frustrations in the lab this tool was developed to allow a live overview of drift gas pressures. Key advantages include:
- No requirement for offline data evaluation
- Standalone tool that can be collecting data whilst MassHunter Data Acquisition is running and acquiring
- Colour coding allows easy determination of the state of drift gas pressures at a glance
- Graphs and all statistics plotted and calculated allowing precise measurement of key data
- Large font allows good visibility even if the PC is at the other end of the adjustment valves
These instructions will help you get this application set up on the controlling data system connected to your Agilent G6560X IM-QTOF
Find the latest release here and download to your PC.
The file that is downloaded may be quarantined by your AntiVirus and so you may need to add an exception in order to use it.
- Specify desired setpoints on the Setpoints tab. The defaults are the current Agilent recommendations.
- Selecting the serial port and clicking connect will provide pre-requisites for connecting to the instrument via the tool. It describes the use of Hyperterminal to begin relaying the data before closing Hyperterminal.
- Click the Start Acquisition button to begin acquiring and storing the instrument output.
- Navigate to the Measure tab to view the output via statistics, graphs or colours. Where the colours denote:
- Green = Good
- Orange = Getting Close
- Red = Much more adjustment required
- The table on the Data tab on the Measure tab can easily be exported into excel by selecting, copying and pasting.
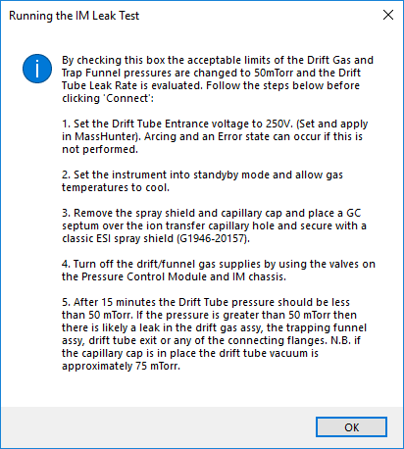
- A leak test has been included for troubleshooting drift gas instability. When the Leak Test checkbox is selected a walk through guide is displayed describing how to set the instrument up to perform the leak test. The set points are automatically updated and the data received is evaluated and colour coded as per the following:
- Green = Acceptable Leak (≤ 50 mTorr)
- Orange = Minor Leak or Capillary Cap is fitted (50 - 75 mTorr)
- Red = Major Leak (>75 mTorr)
Dummy Instrument
For testing away from a real instrument and to speed up development a dummy instrument was quickly developed for offline testing. This is available in addition to the tool itself and can be found under Dummy Serial. It was developed using an Arduino Uno and randomly outputs an identical string to the G6560X IM-QTOF albeit more frequently at 40ms intervals rather than 400ms intervals.
To use the Dummy Instrument simply flash the Arduino with the C++ file provided and select the COM port that the Arduino is connected to the PC with. There is no need to set up a Hyperterminal if demonstrating with the Dummy Instrument.
- Chris Page - Initial Work - Pageyboy
This project is licensed under the MIT License - see the LICENSE.md file for details


