How to add custom monitor data
From nGrinder 3.1.3, nGrinder support the custom monitoring for targets. It can be used if you want to monitor target server statuses which are not provided as default by nGrinder monitor. All you need to do is to use any tools you like to collect the monitor data with some internal time. (It might be best if you set it as same as the sampling interval of nGrinder test.) and the data should be saved in:
- ${ngrinder_agent_home}/monitor/custom.data
The content of this file can have several monitoring values separated with “,” in the single line like below:
315630613,1123285602,1106612131
Then you need to make sure the file is being updated during the test running. If you have a shell script named "update.sh" which updates custom.data file, you can run it regularly by
- watch -n 1 update.sh
nGrinder monitor reads custom.data file periodically if exists and send data to nGrinder controller.
After the test finished, you can see the chart for these data in the target monitoring page of the detailed test report:

Find there are charts named “CUSTOM MONITOR DATA 1”, “CUSTOM MONITOR DATA 2” .., till “CUSTOM MONITOR DATA 5”. nGrinder monitor can collect at most 5 custom data.
In the following guide, I will use java to get the java VM running information with JMX. If the target server is a java application like tomcat, we can use the way in this guide to get the VM running information of tomcat, and display the data in chart in the final report. As I said above, I will use JMX to get the VM data. But in the normal we will not enable the JMX server of tomcat. So we will use attach API to attach to the target process, and enable the “management-agent”, and then we can connect with JMX to the target process.
You can find the VMMonitor.java from gist. Be aware about the code that, in java VM, for different java version and different GC setting, the GC names will be different. So in this code, I get the GC names of current Java VM, and using these names to get target process GC information with JMX. So the Java environment you use to run this code should be same as that you run the target tomcat. And the VM option like “-server” or GC setting should also be same. Otherwise, you can not get the GC names of target tomcat process.
And below, we will use this code to get the GC information of target process and save into custom.data file. The new code is as below:
import java.io.BufferedWriter;
import java.io.File;
import java.io.FileWriter;
import java.io.IOException;
import java.lang.management.GarbageCollectorMXBean;
import java.lang.management.ManagementFactory;
import java.util.HashSet;
import java.util.List;
import java.util.Set;

import javax.management.MBeanServerConnection;
import javax.management.ObjectName;
import javax.management.remote.JMXConnector;
import javax.management.remote.JMXConnectorFactory;
import javax.management.remote.JMXServiceURL;

import com.sun.tools.attach.AttachNotSupportedException;
import com.sun.tools.attach.VirtualMachine;

/**
 * Class description.
 *
 * @author Mavlarn
 */
public class GCMonitor {

    public static Set<String> youngGCNames = new HashSet<String>();
    public static Set<String> oldGCNames = new HashSet<String>();

    static {
        // Oracle (Sun) HotSpot
        youngGCNames.add("Copy"); // -XX:+UseSerialGC
        youngGCNames.add("ParNew"); // -XX:+UseParNewGC
        youngGCNames.add("PS Scavenge"); // -XX:+UseParallelGC

        // Oracle (BEA) JRockit
        youngGCNames.add("Garbage collection optimized for short pausetimes Young Collector"); // -XgcPrio:pausetime
        youngGCNames.add("Garbage collection optimized for throughput Young Collector"); // -XgcPrio:throughput
        youngGCNames.add("Garbage collection optimized for deterministic pausetimes Young Collector"); // -XgcPrio:deterministic

        // Oracle (Sun) HotSpot
        oldGCNames.add("MarkSweepCompact"); // -XX:+UseSerialGC
        oldGCNames.add("PS MarkSweep"); // -XX:+UseParallelGC and
                                        // (-XX:+UseParallelOldGC or -XX:+UseParallelOldGCCompacting)
        oldGCNames.add("ConcurrentMarkSweep"); // -XX:+UseConcMarkSweepGC

        // Oracle (BEA) JRockit
        oldGCNames.add("Garbage collection optimized for short pausetimes Old Collector"); // -XgcPrio:pausetime
        oldGCNames.add("Garbage collection optimized for throughput Old Collector"); // -XgcPrio:throughput
        oldGCNames.add("Garbage collection optimized for deterministic pausetimes Old Collector"); // -XgcPrio:deterministic
    }

    static final String CONNECTOR_ADDRESS = "com.sun.management.jmxremote.localConnectorAddress";

    public static void main(String[] args) throws InterruptedException {
        if (args == null || args.length == 0) {
            System.err.println("Please specify the target PID to attach.");
            return;
        }

        // attach to the target application
        VirtualMachine vm;
        try {
            vm = VirtualMachine.attach(args<a href="/wiki_ngrinder/entry/0" class="notexist">0</a>]);
        } catch (AttachNotSupportedException e) {
            System.err.println("Target application doesn't support attach API.");
            e.printStackTrace();
            return;
        } catch (IOException e) {
            System.err.println("Error during attaching to target application.");
            e.printStackTrace();
            return;
        }

        try {
            // get the connector address
            String connectorAddress = vm.getAgentProperties().getProperty(CONNECTOR_ADDRESS);
            MBeanServerConnection serverConn;
            // no connector address, so we start the JMX agent
            if (connectorAddress == null) {
                String agent = vm.getSystemProperties().getProperty("java.home") + File.separator + "lib"
                        + File.separator + "management-agent.jar";
                vm.loadAgent(agent);
                // agent is started, get the connector address
                connectorAddress = vm.getAgentProperties().getProperty(CONNECTOR_ADDRESS);
            }

            // establish connection to connector server
            JMXServiceURL url = new JMXServiceURL(connectorAddress);
            JMXConnector connector = JMXConnectorFactory.connect(url);
            serverConn = connector.getMBeanServerConnection();
            ObjectName objName = new ObjectName(ManagementFactory.RUNTIME_MXBEAN_NAME);

            // Get standard attribute "VmVendor"
            String vendor = (String) serverConn.getAttribute(objName, "VmVendor");
            System.out.println("vendor:" + vendor);

            String[] gcNames = getGCNames();
            while(true) {
                long minorGCCount = 0;
                long minorGCTime = 0;
                long fullGCCount = 0;
                long fullGCTime = 0;

                for (String currName : gcNames) {
                    objName = new ObjectName("java.lang:type=GarbageCollector,name=" + currName);
                    Long collectionCount = (Long) serverConn.getAttribute(objName, "CollectionCount");
                    Long collectionTime = (Long) serverConn.getAttribute(objName, "CollectionTime");
                    if (youngGCNames.contains(currName)) {
                        minorGCCount = collectionCount;
                        minorGCTime = collectionTime;
                    } else if (oldGCNames.contains(currName)) {
                        fullGCCount = collectionCount;
                        fullGCTime = collectionTime;
                    }
                    StringBuilder sb = new StringBuilder("<a href="/wiki_ngrinder/entry/sb-appendgetgctypecurrname-append-sb-appendcount-collectioncount-sb-append-gctime-collectiontime" class="notexist">");
                    sb.append(getGCType(currName)).append(" : ");
                    sb.append("Count=" + collectionCount);
                    sb.append("     GCTime=" + collectionTime);
                    sb.append("</a>");
                    System.out.println(sb.toString());
                }
                StringBuilder valueStr = new StringBuilder();
                //custom data format is:
                //minorGCCount,minorGCTime,fullGCCount,fullGCTime
                valueStr.append(minorGCCount);
                valueStr.append(",");
                valueStr.append(minorGCTime);
                valueStr.append(",");
                valueStr.append(fullGCCount);
                valueStr.append(",");
                valueStr.append(fullGCTime);
                writeToFile(valueStr.toString());
                Thread.sleep(1000); //sleep one second.
            }
        } catch (Exception e) {
            e.printStackTrace();
        }
    }

    public static String getGCType(String name) {
        if (youngGCNames.contains(name)) {
            return "Minor GC";
        } else if (oldGCNames.contains(name)) {
            return "Full GC";
        } else {
            return name;
        }
    }

    public static String[] getGCNames() {
        List<GarbageCollectorMXBean> gcmbeans = ManagementFactory.getGarbageCollectorMXBeans();
        String[] rtnName = new String<a href="/wiki_ngrinder/entry/gcmbeans-size" class="notexist">gcmbeans.size()</a>;
        int index = 0;
        for (GarbageCollectorMXBean gc : gcmbeans) {
            rtnName<a href="/wiki_ngrinder/entry/index" class="notexist">index</a> = gc.getName();
            index++;
        }
        return rtnName;
    }

    public static void writeToFile(String gcData) {
        String currDir = System.getProperty("user.dir");
        BufferedWriter writer = null;

        try {
            File customFile = new File(currDir + File.separator + "custom.data");
            if (!customFile.exists()) {
                customFile.createNewFile();
            }
            writer = new BufferedWriter(new FileWriter(customFile));
            writer.write(gcData);
            writer.flush();
        } catch (IOException e) {
            System.err.println("Error to read custom monitor data:" + e.getMessage());
        } finally {
            if (writer != null) {
                try {
                    writer.close();
                } catch (IOException e) {
                    e.printStackTrace();
                }
            }

        }
    }
}
Some comments about the code are:
a) We need to pass the target process ID as arguments to run.
b) This code should be run under same java environment and VM option with the target process. Otherwise, the attaching will properly fail. And if the target tomcat process is running with “-server” option, also be aware to set “-server” option to run this java code.
Because under different java version and setting, the GC names will be different, I founded some names and their types(minor or full GCl). They are not complete and maybe not very correct. If you use IBM JVM, you should modify the code by yourself.
c) The custom values format is “minorGCCount,minorGCTime,fullGCCount,fullGCTime”.
d) This java code should be run in “${ngrinder_agent}/monitor/” directory. Because in the code, it will create custom.data file in current directory.
e) To compile the code, it needs “tools.jar” of JDK. You need to compile it like this:
javac -cp /home/ngrinder/jdk1.6.0_38/lib/tools.jar GCMonitor.java

#get target tomcat process ID, it is 24003
java -cp /home/ngrinder/jdk1.6.0_38/lib/tools.jar: GCMonitor  24003
Then you should see the output in console as below:
current dir:/home/ngrinder/.ngrinder_agent/monitor
<a href="/wiki_ngrinder/entry/minor-gc-count3564-gctime27850" class="notexist">Minor GC       : Count=3564    GCTime=27850</a>
<a href="/wiki_ngrinder/entry/full-gc-count166-gctime65525" class="notexist">Full GC        : Count=166     GCTime=65525</a>
<a href="/wiki_ngrinder/entry/minor-gc-count3564-gctime27850" class="notexist">Minor GC       : Count=3564    GCTime=27850</a>
<a href="/wiki_ngrinder/entry/full-gc-count166-gctime65525" class="notexist">Full GC        : Count=166     GCTime=65525</a>
And in custom.data file, the content is:
3564,27850,166,65525
Then, create a new test on nGrinder and set the target host properly. You can see the chart in test report:
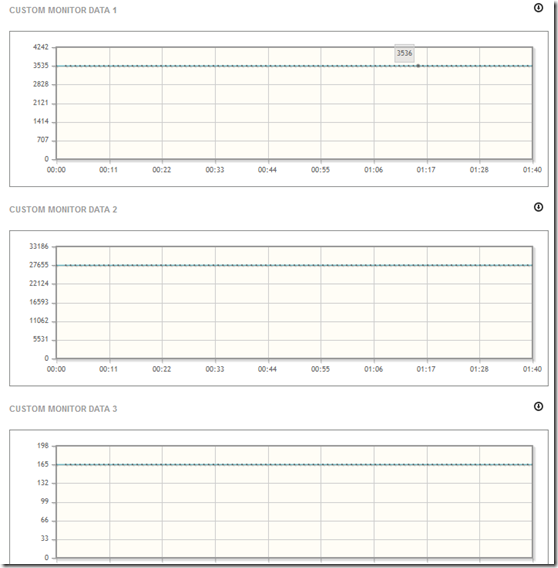
(Because the GC count is not changed very much, so we can not see much difference from the chart.)
In this way, you can add any kind of custom monitor data and check it from test report.