Suppose we observe N subjects, each subject at multiple timepoints and we want to estimate a trajectory of progression of measurements in individual subjects. For example, suppose you observe BMI of N children at different ages, as presented below
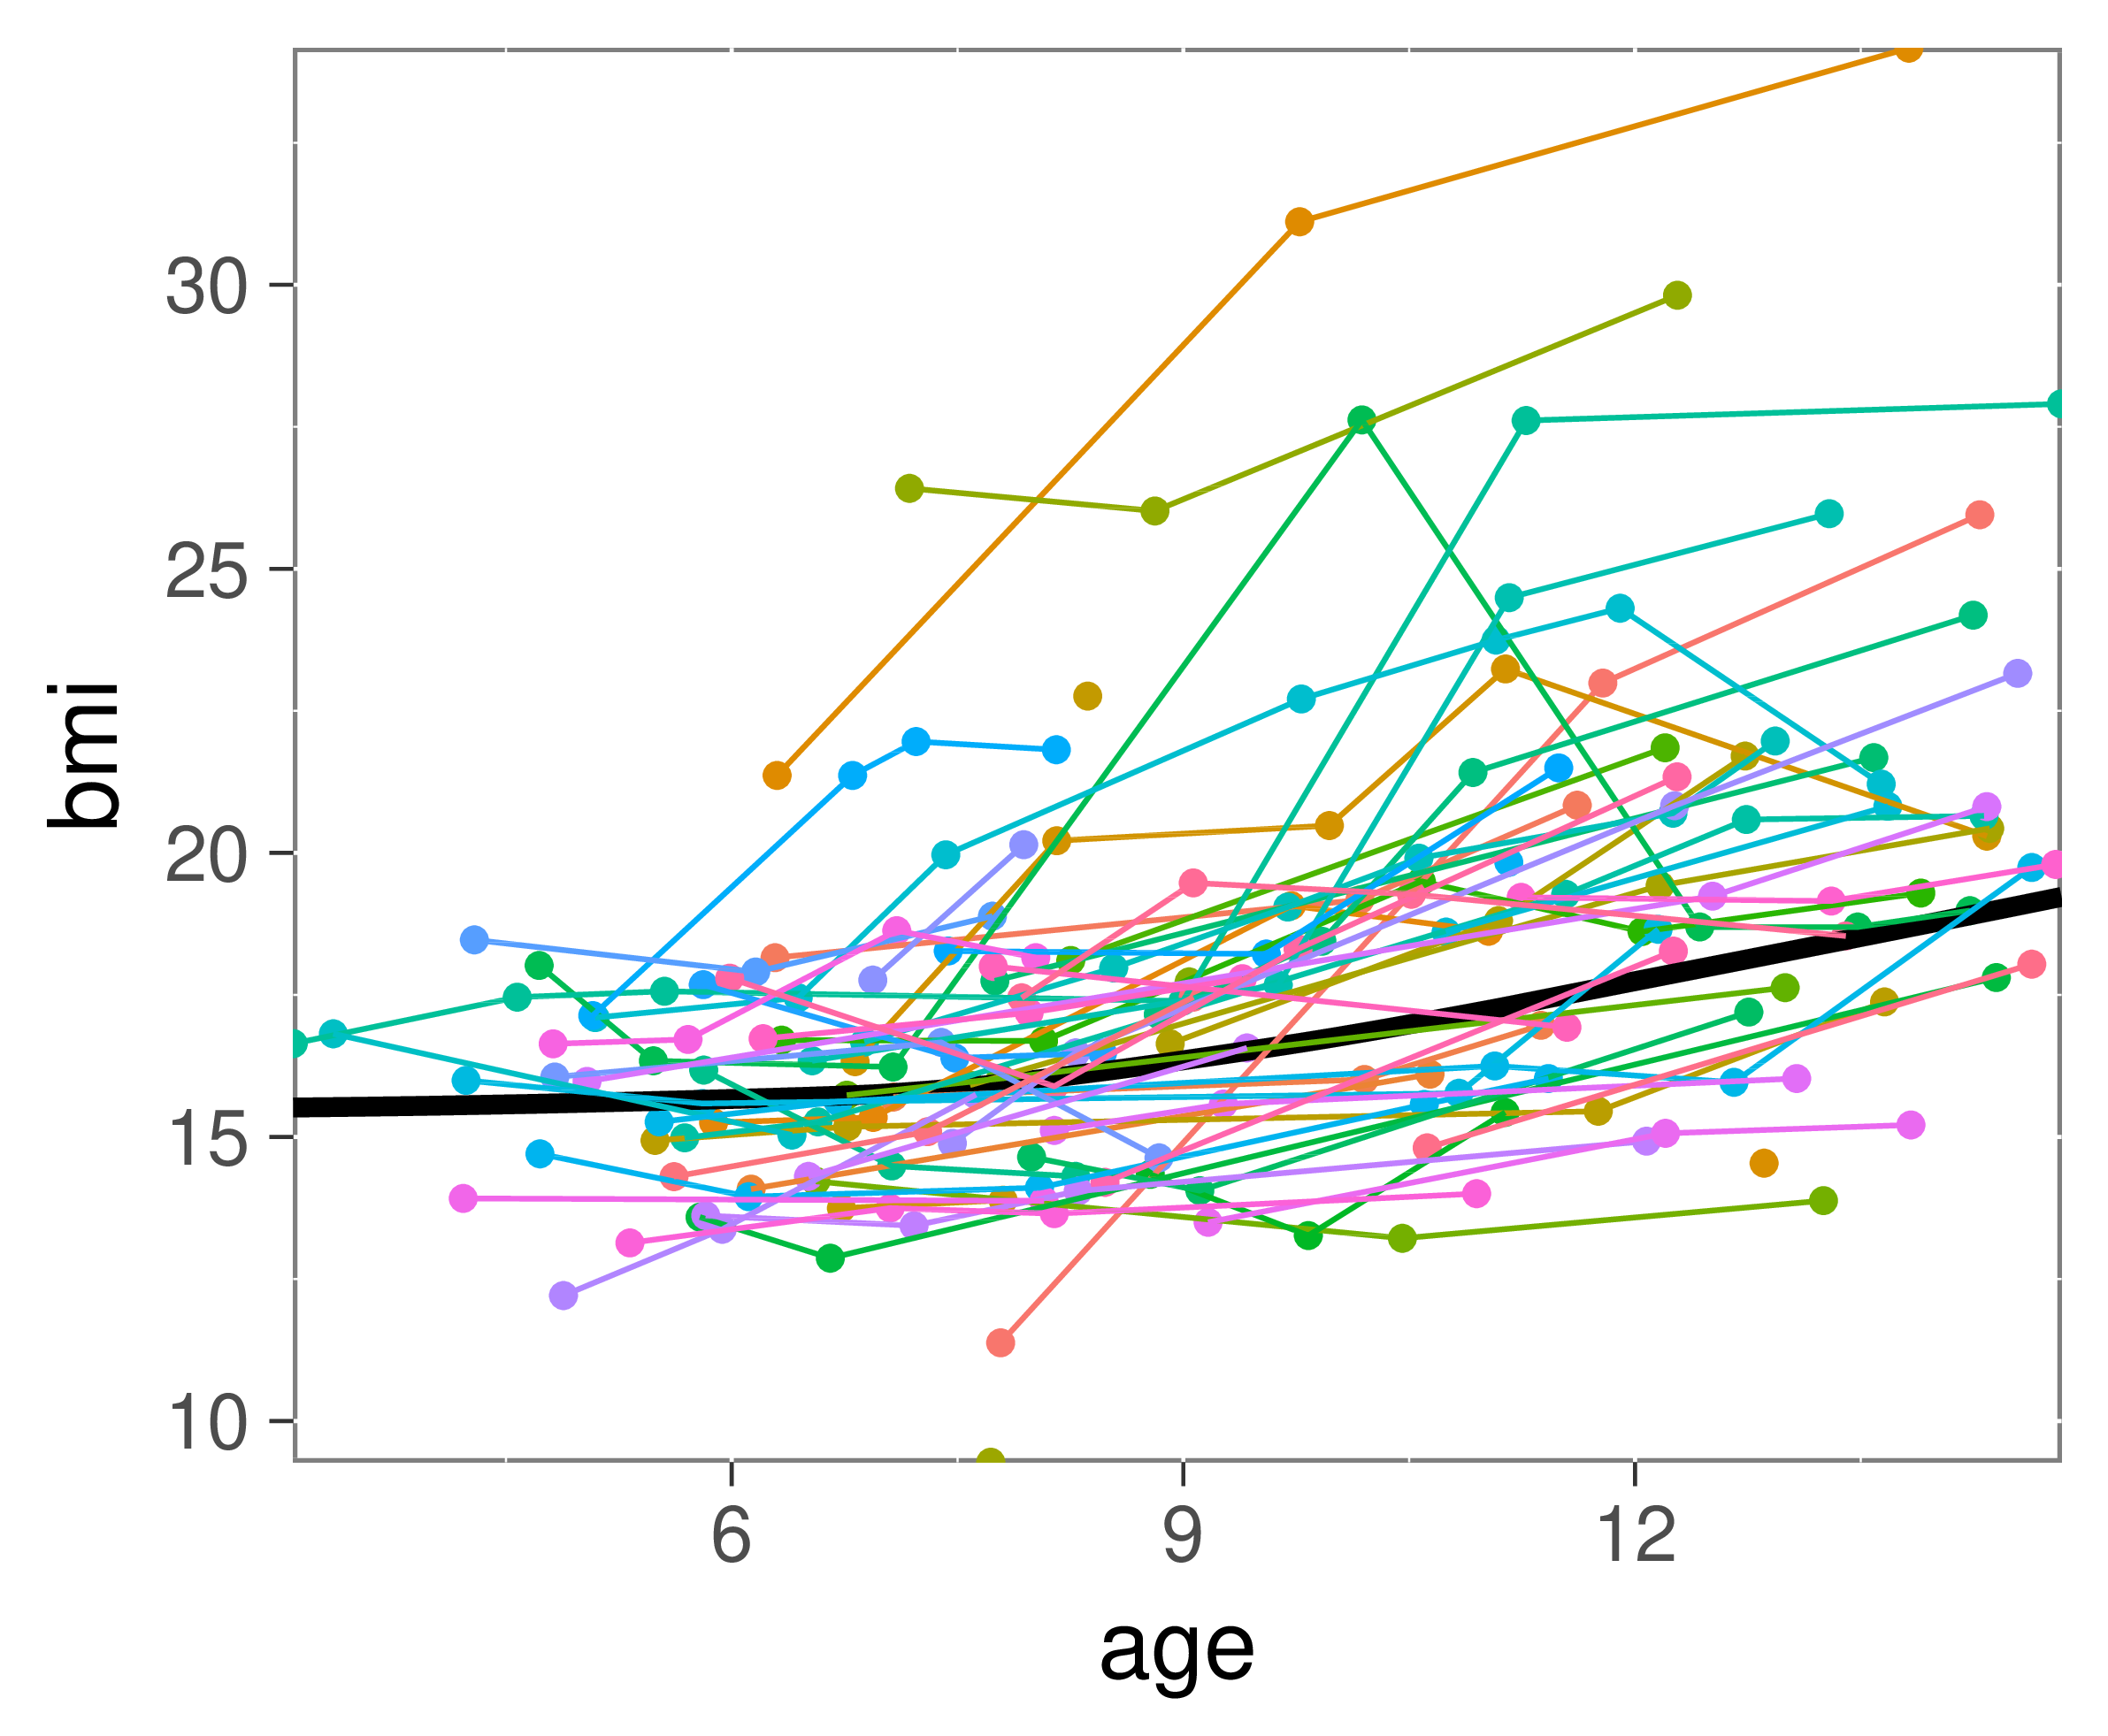
Here, the connected dots come from individual subjects and the black thick line corresponds to the population mean.
In this package we follow the methodology from Kidziński, Hastie (2018) to fit trajectories using matrix completion. To this end, we discretize the time grid some continous basis and find a low-rank decomposition of the dense matrix.
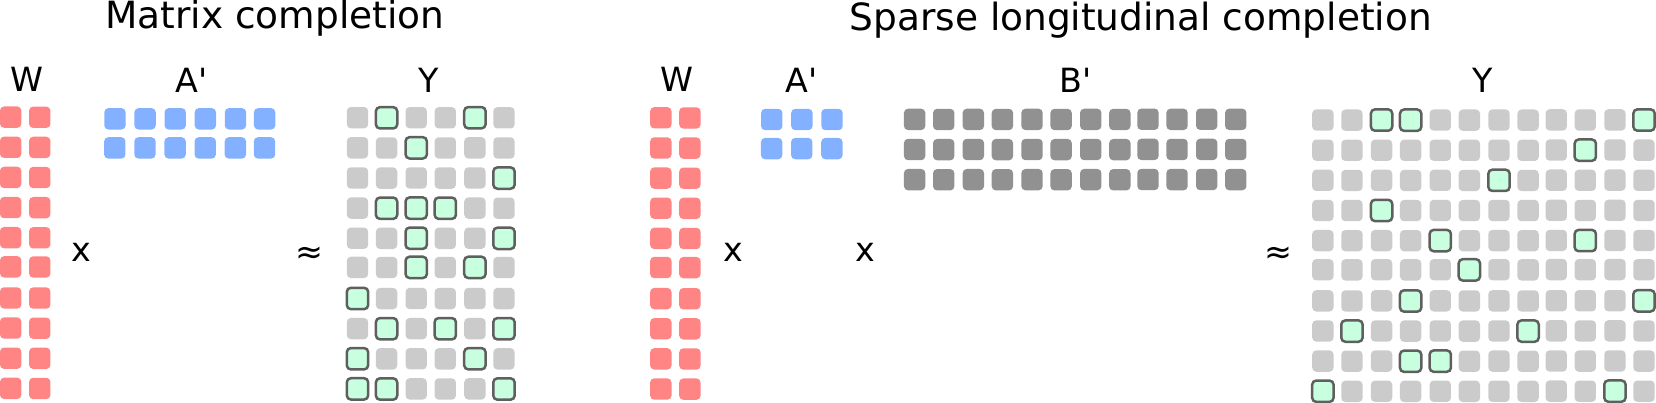
In the classical matrix completion, we look for matrices W and A that fit the observed points in Y (green points in the image above). In our method, in order to impose smoothness, we additionaly assume the basis B and again we look for the reprezentation minimizing the errror.
The interface of the package is based on the mixed-effect models in R. In particular, if we are given temporal observations Y in the long format with columns id, age and bmi, while additional covariates X, constant over time are given as a data frame with columns id and, say, gender, we can fit the model by writing
model = fregression(bmi ~ age + gender | id, data = Y, covariates = X)
print(model)
For more information, please refer to the manual and to vignettes.
library("devtools")
install_git("https://github.com/kidzik/fcomplete/")
See vignettes (https://github.com/kidzik/fcomplete/tree/master/vignettes) for example use.
For now it's designed for editing in R Studio.
- Open RStudio
- Open
fcomplete.Rprojproject - Install packages:
devtools,ggplot2,mclust - Open the
examples/example.Rscript - Run the script. The script will:
- Install our
fcompletepackage - Load simulated data
- Run the method
- Plot estimates, components and projections,
- Run basic clustering on projections
- Install our
You can generate the manual by running
R CMD Rd2pdf fcompletefrom the parent directory to fcomplete.
Examples are in tests for now. The main two examples (from the paper) are:
simulation.full.R-- the simulation study from the paperdata.full.R-- the data study from the paper