Panel Tracing
The panel under the icon shows ROI creation/grouping options:
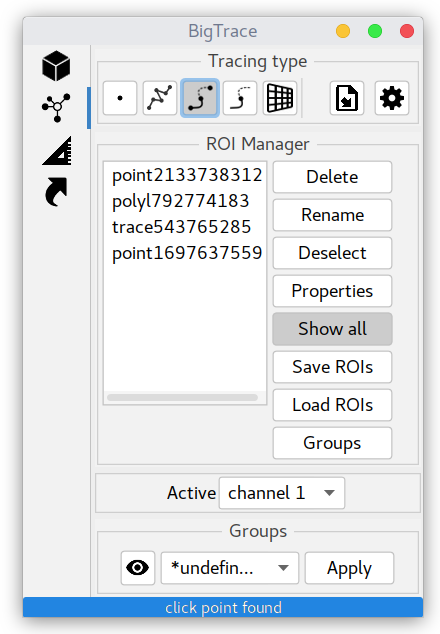
The set of toggle buttons defines, what type of ROI will be added to the ROI manager upon point addition.


For the description of ROI interface please refer to Creating ROIs page.

A general ROI render settings can be configured in settings 
Dialogs showing semi-auto tracing and one-click tracing parameters can be opened by double-clicking on the corresponding
There is a possibility to import ROIs from external data using button.
This subpanel contains an interactive list of ROIs. A selected ROI is usually rendered with different colors (they can be defined in these settings, see below).
Double-clicking on the ROI name in the ROI Manager list brings the viewer's focus (zoom) to it. The fraction of screen occupied by ROI after zooming in can be adjusted by Zoom box screen fraction parameter.
A name for a new ROI is generated automatically and can be changed using Rename button.
If an ROI is a member of Groups, its name will contain a prefix in square brackets (first three letters of the group name).
Delete and Deselect buttons will do exactly what one would expect them to do.
Show all toggle button defines if all ROIs in the list are rendered or only the currently selected ROI is displayed.
Properties dialog defines individual ROI's render and measurement parameters:

Time Point field specifies to which time frame the ROI is assigned. Time frames are indexed from zero.
The values of Point size and Line thickness parameters are specified in voxels. They define intensity and volume measurements for this ROI.
The opacity parameter changes ROI opacity only with respect to other ROIs (not the image volume itself). To "see-through" ROI we advise changing the render type to Wire.
Render as: selection box specifies how ROIs are rendered.
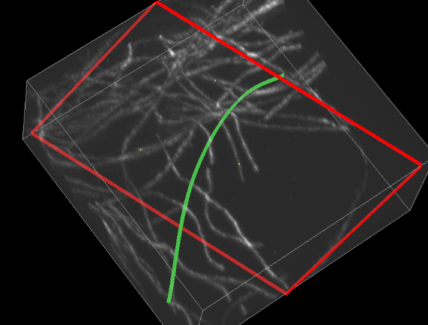
In the "Outline" mode only a center line (for curve ROIs) and cross-section border are shown:
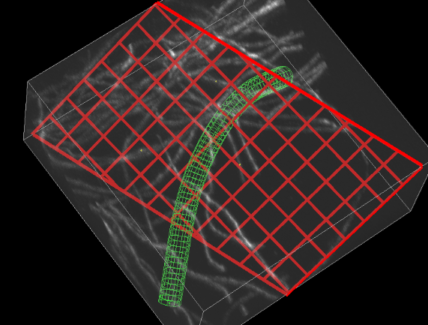
In the "Wire" mode the wireframes of ROIs are rendered:
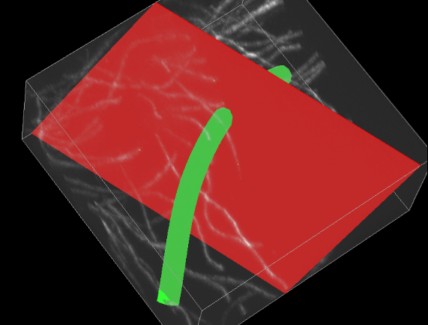
and in the "Surface" mode, well, the surface is rendered:
Point3D ROIs are rendered as circles in Outline/Wire modes and as disks in the Surface mode.
These settings are for visualization only, they do not affect ROI measurements.
To change the appearance of a batch of ROIs, a similar dialog of Groups can be used.
Save/Load ROIs buttons work with BigTrace ROIs File format.
In the case of multi-channel images, only the intensity of the channel (source) selected in the Active: box will be used for Creating ROIs.
Newly added/created ROI will be automatically assigned to a group, currently selected in the Groups drop-down menu.
To re-assign ROI to a new group, select it (in the list or on the canvas with the shortcut E) and press "Apply" button.
ROI group visibility can be toggled using button 
This dialog under the
These are global rendering parameters, common for all ROIs.
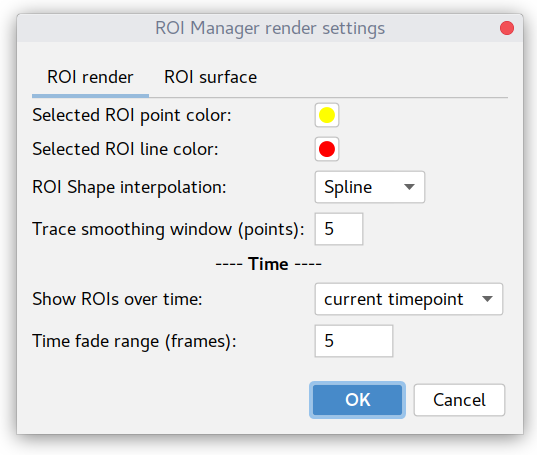
The first two parameters (Selected ROI point and line color) specify colors of active (selected) ROI.
ROI shape interpolation option specifies how ROIs are displayed and measured. NB: it is synchronized with the corresponding measurement option.
Trace smoothing window (points) defines a window for smoothing of line traces (LineTrace3D) in Smooth mode and positioning of nodes for the spline fitting (in a Spline mode). In short, the larger the value, the more smooth the trace will be. See the link above for more details on the procedure.
---- Time ----
Show ROIs over time: option available for timelapse data. In the current timepoint mode, only ROIs present at the current time frame will be rendered on canvas.
Backward/forward in time modes allow to render ROIs from previous/next time points specified by the range indicated in Time fade range (frames) parameter. ROIs from adjacent time points are rendered with decreasing opacity, depending on their "time distance" from the current position.
This panel specifies how the surface or ROIs is rendered
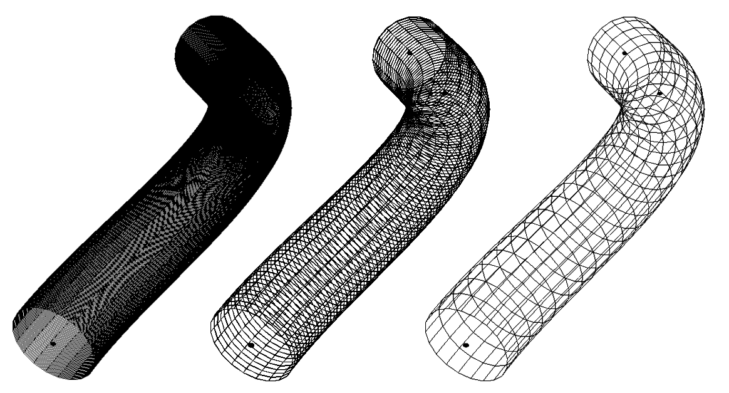
# edges at curve cross-section parameter defines how many sectors are created for the visualization of pipe (cylinder) contours around PolyLine3D and LineTrace3D ROIs. It affects only visualization, the intensity measurements will always happen around a circle (up to pixelization rounding).
Here is an example of the same ROI rendered with sectors number 4, 10, and 20:

---- Wire mode ----
Distance between curve contours (px) defines the distance between the pipe's contours along the ROI.
It can be useful if you want to "look inside ROI".
Here is the same ROI rendered with the distance of 1, 5, and 20 pixels between contours:
Plane/cross-section ROI grid step (px): defines the density of the displayed grid for the CrossSection3D ROI type. The larger the value, the more sparse the grid.
Here is an example with the step of 10 (left) and 50 (right) pixels:
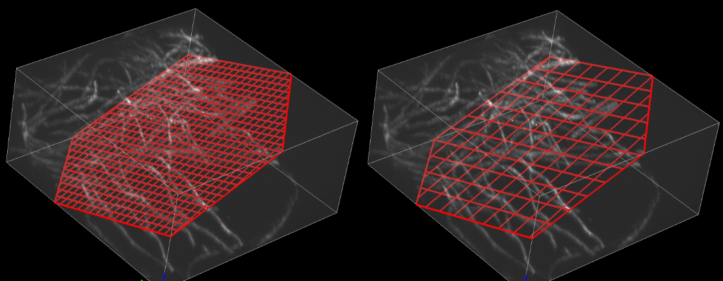
In short, it allows tuning the "transparency" of the cross-section plane ROI.
---- Surface mode ----
ROI surface render type parameter defines how the ROI is rendered in the "Surface" mode, it is a copy of the Panel View/Crop#roi-surface choice box.
Settings at this tab define parameters for both Semi auto tracing and One-click tracing modes.
Curve thickness along axes parameters specify the approximate thickness of curves of interest in each dimension (in pixels!). A good estimate for these values can be made by plotting the intensity profile perpendicular to a curve in each dimension and fitting it with the Gaussian function. SD of this Gaussian is the value that is needed.
Basically, it is an SD of Gaussian Derivative convolution filters for each dimension used to calculate the Hessian matrix.
Alternatively, one can look at the rendered TraceBox volume, if the curves are too dotty, these values can be increased.
Trace only cropped volume checkbox decides, in case of crop applied to a dataset, whether the tracing will continue outside the cropped volume.
Trace box size (px) specifies dimension of TraceBox. Basically, it is the length of the edge of the cube/box displayed in the Semi auto tracing mode.
Trace box screen fraction (0-1): How much the plugin should zoom in to the TraceBox. In the case of 1 the TraceBox will occupy the whole viewer window.
Trace box advance [0-center..1-edge] initial TraceBox always has the initial point in the middle of the box. But after advancing it (with T) shortcut, this option specifies, where TraceBox will be positioned with respect to the last added point. The plugin calculates the last direction of the curve and positions the last point along this direction either at the edge (value 1) or the center of the box (value 0).
Orientation weight (0-1): It is a bit complicated parameter. Basically, when the plugin searches for the best path between two points, it minimizes the "travel function" (or cost) based on the "tubeness" of voxels along the path and the orientation of the curve inside those voxels. This parameter defines, how much each term contributes to the cost minimization (0 = only "tubeness", 1 = only orientation). The implementation is similar to NeuronJ, see the paper for details.
Intermediate vertex placement (px, >=3) How often intermediate points (vertices) will be placed in LineTrace3D during auto-tracing. Smaller values make tracing a bit slower, but they make further ROI editing easier.
** Constrain directionality (0-1)** instructs the auto-trace algorithm on how "straight" you expect the curve to be. Higher values correspond to the more straight curves, while lower values allow more bent, flexible curves. In more details: it is a minimum of a cosine of the angle between curve calculated direction in two neighboring voxels.
The dialog under button allows importing of ROIs from external sources.
At the current moment (v.0.3.0) only import of Point3D ROIs from Trackmate XML files
produced by executing "Export tracks to XML file" command (in the last panel of Trackmate) are supported.
NB: The size and rendering details of the imported ROIs will be defined by the currently selected Group in the Groups box (by default undefined). So we advise you to adjust these settings beforehand.
The color of imported ROIs can be either selected randomly per track or inherited from the Group settings.
Imported ROIs names reflect track number and point number within in. The visibility of ROIs from previous/next time points can be adjusted in the settings.
Note that since imported ROIs are just a set of points, track's edges are not rendered.