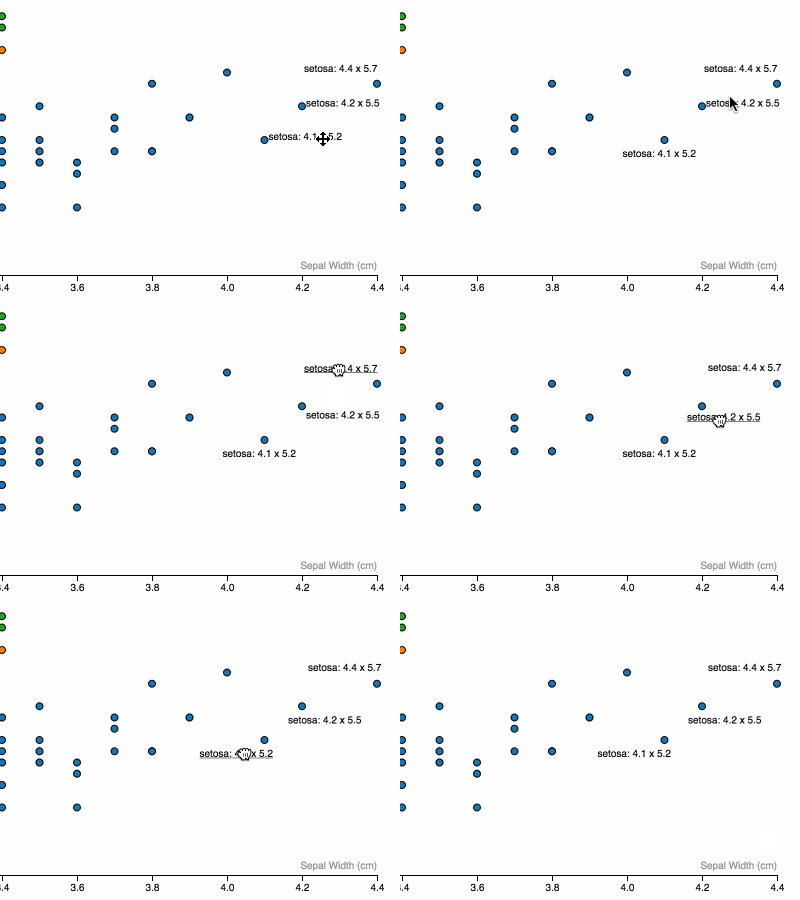
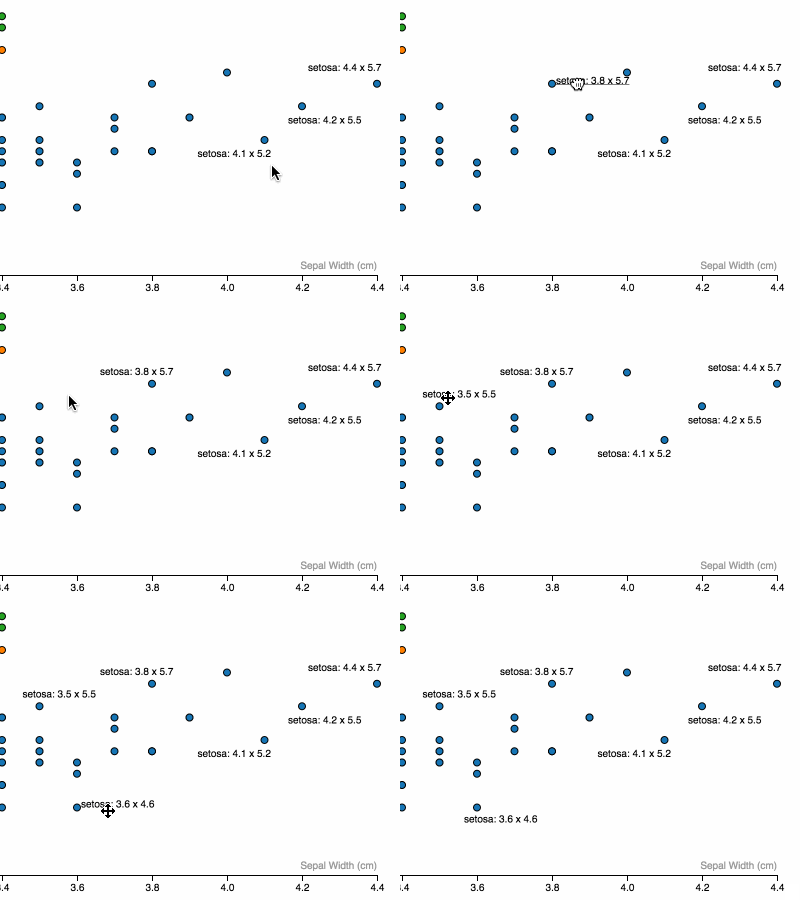
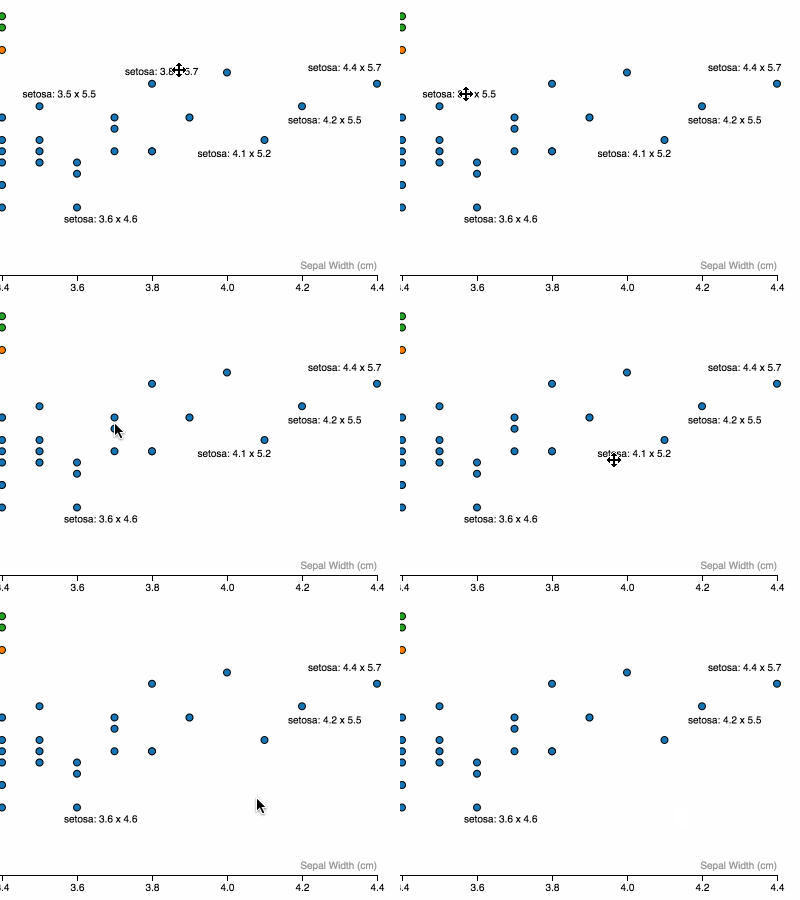
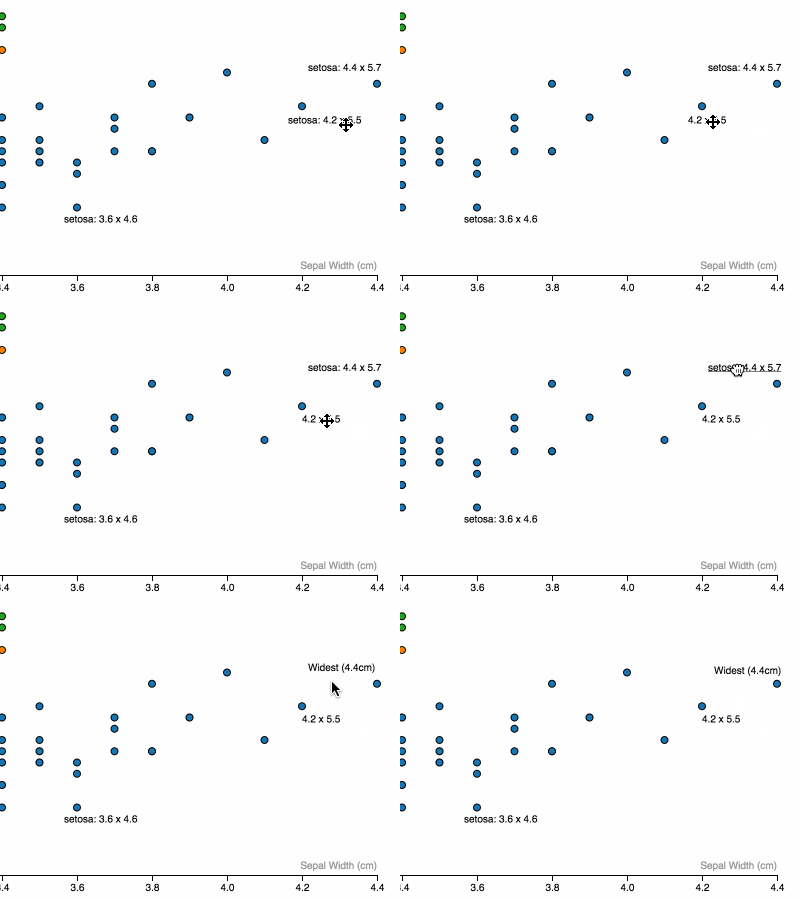
Interactively add, edit, move and save SVG chart annotations.
If you use NPM, npm install d3-annotate. Otherwise, download the latest release.
####d3.annotate()
Initialize a new annotation behavior.
Sets container to render annotations to. _Note: should have translate to match data.
Sets key to be used for serializing annotations and joining annotations with data
Sets the default text for an annotation. eg: .text((d) => `${d.name}: ${d.score}`)
.attr will get called on <text> elements created from annotation. However, instead of only having access to the bound data(d.data) - you have access to what is returned from .getBBox() of the target element (d.box), eg:
// Place labels to the left of target element (centered vertically and horizontally by default)
.attr('x', (d) => d.box.x)
.attr('text-anchor', 'end')

// Color labels based on data in target element
.attr('fill', (d) => palette(d.data.category))Create annotations automatically(true will create an annotation for every datum)
Add object of annotations to be rendered on .call(annotation), created from calling annotation.serialize()
Returns an object of annotations based on current state of annotations.
// render some chart elements with data
var bubbles = chartArea.selectAll('.bubble').data(cars) ....

var annotation = d3.annotate()
      .continer(chartArea.append('g'))
      .key((d) => d.model + d.year)
      .text((d) => `${d.make} ${d.model}: ${d.mpg} miles per gallon`)
      .show((d) => d.year === 2016) // create annotations only for 2016 models, initially
      .saved({'prius2015':{text:'Most efficient',x:400,y:600}})
      .attr('fill', (d) => makeColors(d.data.make));

d3.selectAll('.bubble').call(annotation); // <text> elements get created
[User interaction to move, edit, rewrite annotations]
JSON.stringify(annotation.serialize()) // can be saved for creating inital annotation stateTo style annotations, use a selector a la:
#myChart .d3-an-container .annotation For a better experience, add the following CSS to your page or CSS build system:
.d3-an-container .annotation { cursor: move; }
.d3-an-container .annotation.dragging {
  cursor: grabbing;
  cursor: -moz-grabbing;
  cursor: -webkit-grabbing;
  text-decoration: underline; }
.d3-an-text-edit {
  position: fixed;
  top: 40px;
left: 40px; }By @ChrisPolis
This project is licensed under the terms of the MIT license.


