This repository contains the scripts referring to a methodology that performs the deforestation mapping using UNets and satellite images from Sentinel-2,
being part of my master's thesis in Environmental Science and Technology.
The methodology was tested for mapping deforestation spots using images from the Amazon and Atlantic Rainforest biomes,
located in Brazil. Therefore, the files presented in the "Files" folder refer to UNets trained using images from these both regions.
The results of these applications are being evaluated in journals and the access links will be made available as soon as they undergo peer review.
To identify deforestation in areas where UNet has already been trained (Amazon and Atlantic Rainforest), it is possible to directly use the scripts presented in the Deforestation-mapping folder and the files available in "Files". Otherwise, it is necessary to carry out a new training, using the training files of UNet in the folder of the same name. To do so, you must have the training images and their respective masks at hand.
The UNet training procedures are described in the README.md file, found in the UNet folder.
For a new training to be used in the deforestation mapping algorithm, pay attention to using Level 2A Sentinel-2 images and a composition of
RGB + Near-infrared images (Bands 4-3-2-8).
For masks, non-forest regions are represented by the value 0, while forest areas are represented by the value 1.
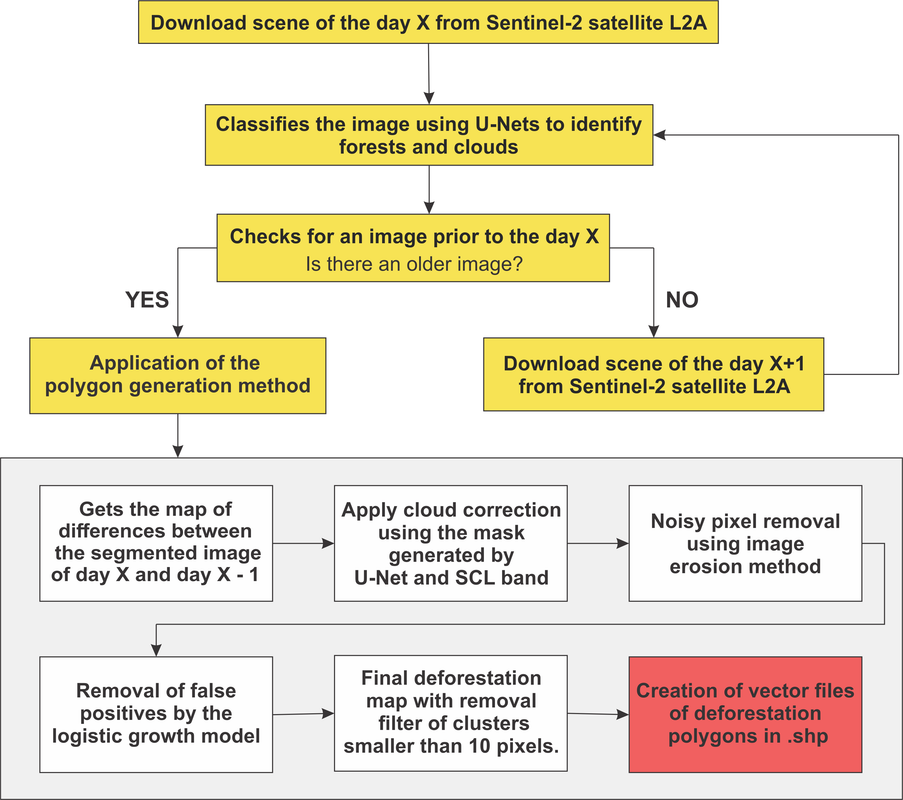
The following figure shows the work flow of the proposed method (extracted from Bragagnolo et al., 2021):
The scripts for this functionality are in the "Deforestation-mapping" folder.
To execute the algorithm, use the file deforestation_main.py, where some information must me added:
# scripts that must be in the same path that this one
from deforestation_mapping import *

# .GEOjson file of the area to be monitored
geojson_file = '/rondonia_square3.geojson'

# path to save the downloaded images
save_imgs = '/Downloaded'

# save RGB files
save_rgb = '/rgb_files'

# save tiles
save_tiles = '/tiles_imgs"

# Unet weights file
unet_weights = "/weights_file_of_trained_UNet.hdf5"

# Unet weights clouds file
unet_clouds = '/weights_file_of_clouds_trained_UNet.hdf5'

# classificated images path
class_path = "/predicted"

# classificated clouds images path
class_clouds = "/predicted_clouds"

# polygons save
poly_path = '/polygons'

# files saved after the trained UNet
percentiles_forest = ["/bands_third.npy",
                       "/bands_nin.npy"]

percentiles_clouds = ["/bands_third_clouds.npy",
                       "/bands_nin_clouds.npy"]

def_main(save_imgs, save_rgb, save_tiles, unet_weights, unet_clouds,
         class_path, class_clouds, poly_path,
         percentiles_forest, percentiles_clouds, geojson_file)
Some settings must also be made in the file deforestation_mapping.py, as credentials for accessing the Sentinel-Hub (user and passwrod) and defining the time period to be covered by the analysis (parameter date):
# connect to the API
user = 'USERNAME'
password = 'PASSWORD'

api = SentinelAPI(user, password, 'https://scihub.copernicus.eu/dhus')

# search by polygon
footprint = geojson_to_wkt(read_geojson(boundsdata))

# search for the images
products = api.query(footprint,
                 date = (["NOW-30DAYS","NOW"]),
                 area_relation = 'IsWithin',
                 platformname = 'Sentinel-2',
                 processinglevel = 'Level-2A',
                 #cloudcoverpercentage = (0, 20)
                )
At the end of the algorithm, raster images will be obtained indicating the deforestation spots for the given image, as well as vector files, in the shapefile .shp format, also indicating the deforested areas.
Bragagnolo, L., R. V. da Silva, and J. M. V. Grzybowski. "Towards the automatic monitoring of deforestation in Brazilian rainforest." Ecological Informatics (2021): 101454. https://doi.org/10.1016/j.ecoinf.2021.101454
Bragagnolo, L., Roberto Valmir da Silva, and José Mario Vicensi Grzybowski. "Amazon forest cover change mapping based on semantic segmentation by U-Nets." Ecological Informatics 62 (2021): 101279. https://doi.org/10.1016/j.ecoinf.2021.101279
Python 3.0
Keras and Tensorflow
sklearn
rasterio
rkimage
fiona
cv2
numpy_indexed
sentinelsat
zipfile
glob
matplotlib
