![]()
Stator AFM is easy to use portfolio management software for traders and investors. Stator is highly analytical and comes with a free visualisation add-on allowing users to go nuts creating interesting visualisations of their financial, trading and investing data.
The visual studies in this repository are compatible with add-on version 3.3.16230+
To put this in simple terms, Stator is portfolio management software. Ever seen the movie 'Wall Street' or 'The Wolf of Wall Street'? Well it's software that can be used by those individuals as well as any other, down-to-earth trader or investor. It's more than likely the people using Stator are more like you and I than Gordon Gekko!
Visit the website to learn more: Stator AFM website
And yeah, I am the human that wrote Stator so send me some love if you don't mind!
- Team Members
- What is visual studies?
- Show me pictures
- How does it work?
- The data domains within Stator
- The underlying data
- The development environment
- I want to contribute
- License
- Anthony Nosek ([email protected])
- You?
I wanted to give users of Stator as much flexibility as possible in analysing their data. With the evolution of HTML5 and javascript visualisation libraries it was only natural that someone (aka me) try and merge everything into desktop software. The end result is a free add-on that leverages HTML5 technology directly in the desktop environment.
Stator exposes data at various 'domains' within the software and users can write visualisations using any of the popular visualisation libraries available. At the current time visual studies supports the following libraries:
Those are the big boys of javascript visualisation libraries right there, from left to right they are:
- Chart
- D3 - Data Driven Documents (version 3 or 4+)
- DC - Uses D3 v3
- Dygraphs
- ECharts
- Paper
- Processing
- Raphael
Please note: Visual studies functionality has been designed in such a way that supporting new libraries is a piece of cake. We've tried to make visual studies as future-proof as possible.
Here are a couple of pictures that should give you an idea what visual studies is all about. Normally, within Stator data is displayed in tabular form, for example we do this when displaying open or closed positions. This is a very traditional way of displaying information to a user and can often hide patterns within the data that we should look to explore and learn from.
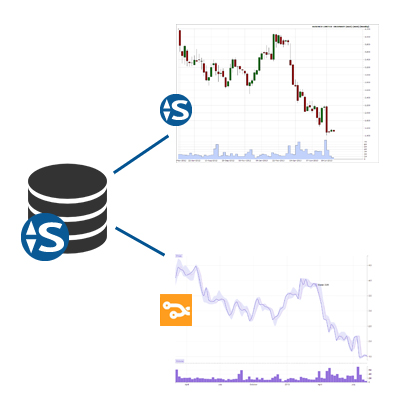
Markets Charting data domain
Open Positions data domain
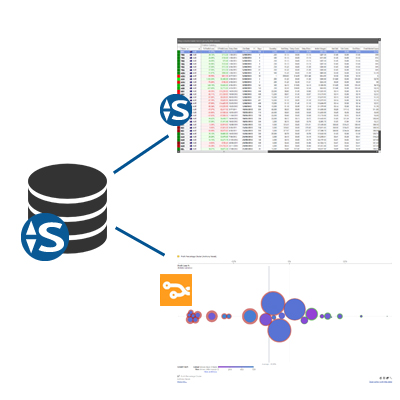
What can be seen in the two pictures above are two alternatives to the same underlying data. The data repository is shown on the left, it looks like a dark barrel. On the right are two images, the default Stator screen is shown above and an alternative visualisation of the same data shown underneath.
And the picture below... This is a visual study generated in Stator for closed positions. This is a cluster plot of close position profit/loss. It gives you an idea what is possible with visual studies, the code for this visualisation is provided in this repository.

Great question!
At the current time you can write visualisations for the following data domains (internal to Stator):
- None - you obtain your own JSON
- Markets - Charting
- Markets - Watchlist
- Home - Summary
- Estate - Summary
- Estate - Cash accounts
- Estate - Cash transactions
- Estate - Diary entries
- Estate - Position statistics
- Estate - Open positions
- Estate - Income
- Estate - Closed positions
JSON - (JavaScript Object Notation) is a lightweight data-interchange format.
JSON is easy for humans to read and write and easy for machines to parse and generate. The following code extract is an example of data in JSON format. I am sure you already know this...
{
	"widget": {
		"debug": "on",
		"window": {
			"title": "Sample Konfabulator Widget",
			"name": "main_window",
			"width": 500,
			"height": 500
		}
	}
}
For the various data domains Stator exposes the data in JSON format. Each visualisation study automatically allocates the data to a variable which you can use in your visualisation. And depending upon which visualisation library you choose will determine the code syntax that you'll write.
Creating the functionality to display visualisations within Stator wasn't enough. I needed to enable users to write and execute code (visualisation code) within Stator. I had know other choice than to write a custom development environment (integrated development environment [IDE]) within Stator.

Visual studies development environment
I'd like that!
There are a couple of things you need to do before you can start contributing or writing your own visual studies. These requirements are listed below:
-
Download and install Stator
Inside the Stator installation folder will be two empty folders called:- "visual studies"
- "visual studies libraries"

-
Download the visual studies add-on
Downloading the visual studies add-on is simply downloading all the library files that Stator requires in order to load the visualisations. After you install visual studies the libraries folder should contain files such as:
-
Read through the visual studies installation guide
-
Open the visual studies IDE
-
Start coding, experimenting and creating your own awesome visualisations!
These visual studies are intended to be used with Stator - Advanced Finance Management software. If you create anything new and exicting please let the community know. That's all, play nice!