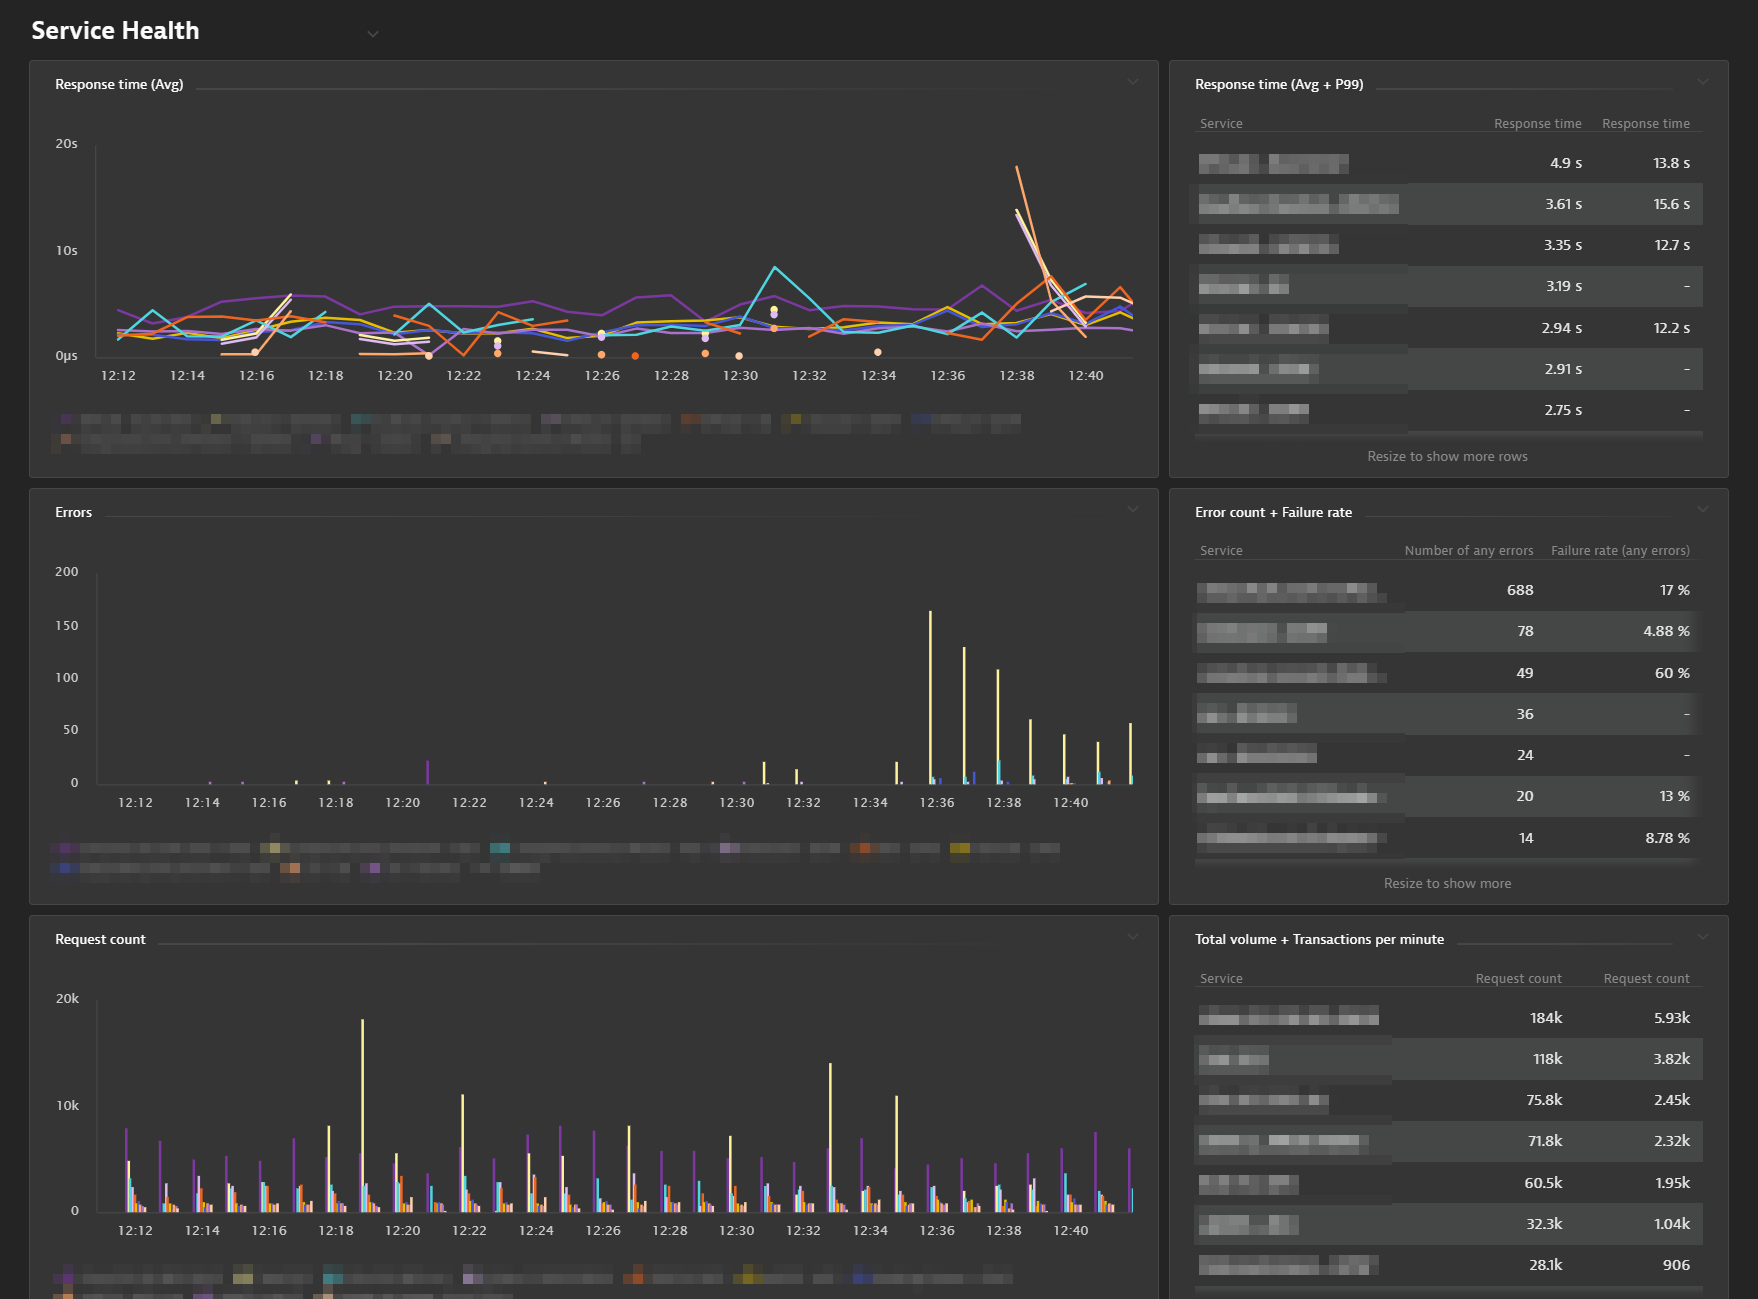
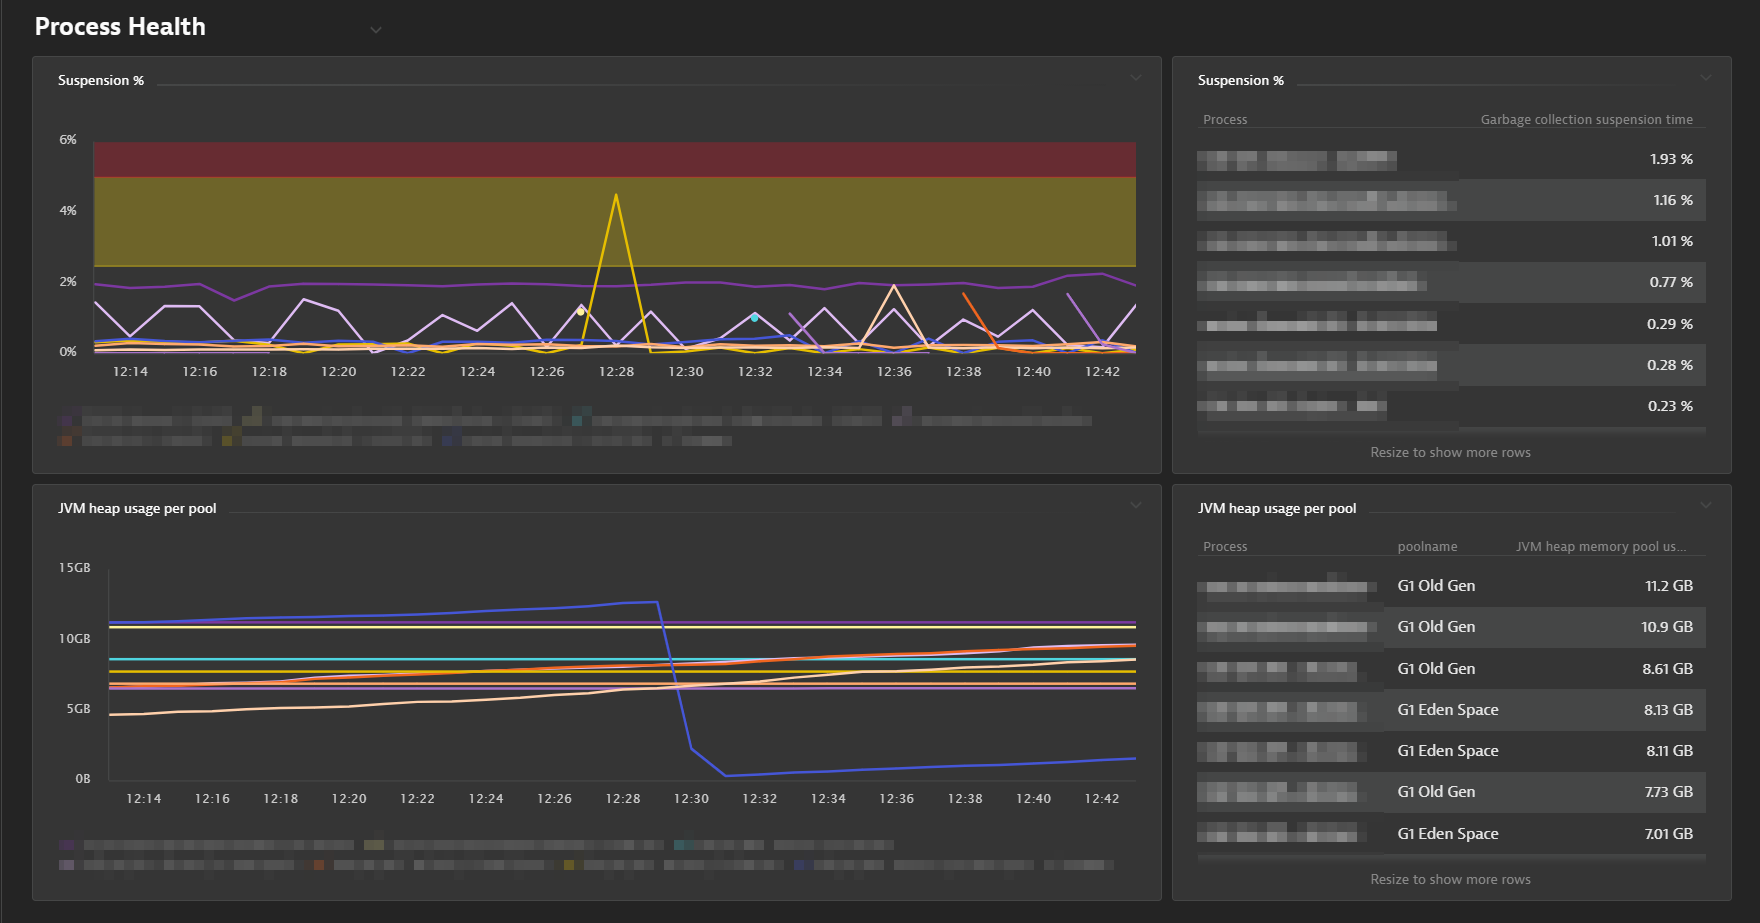
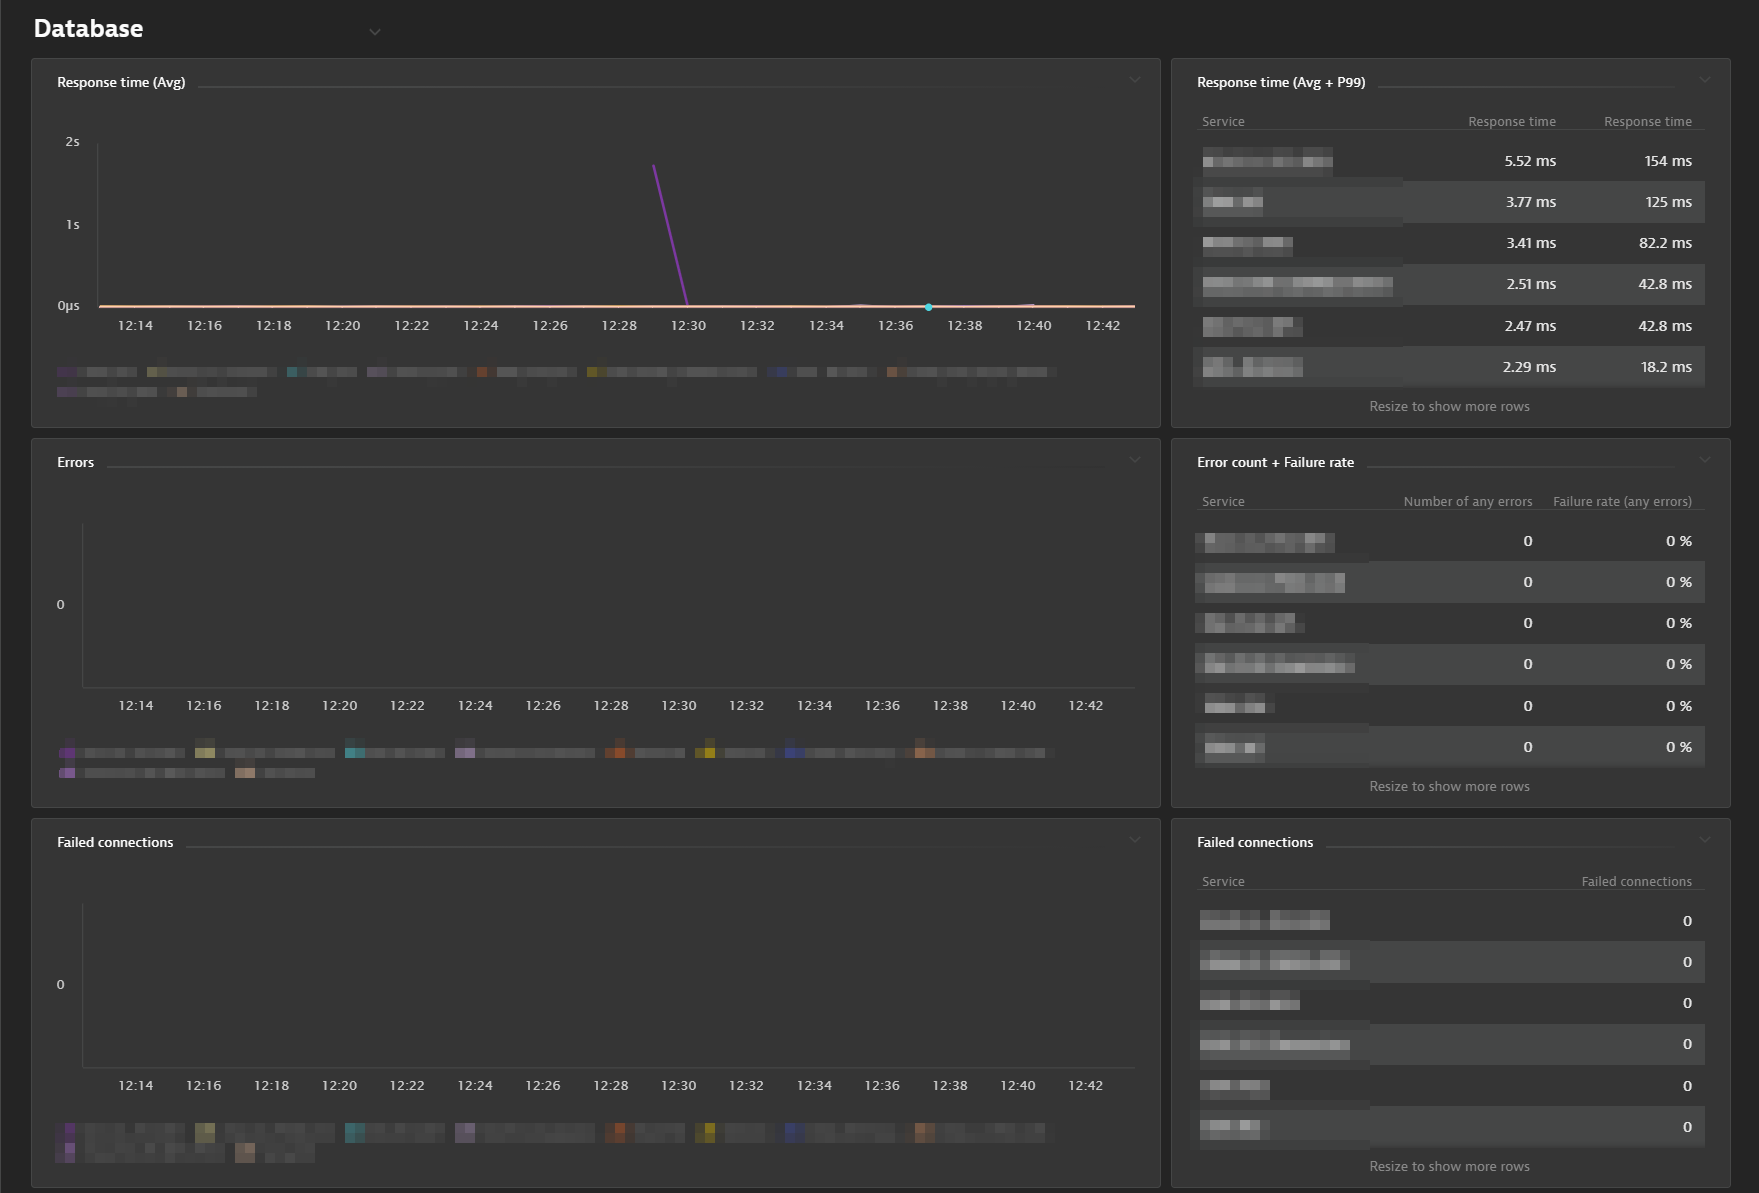
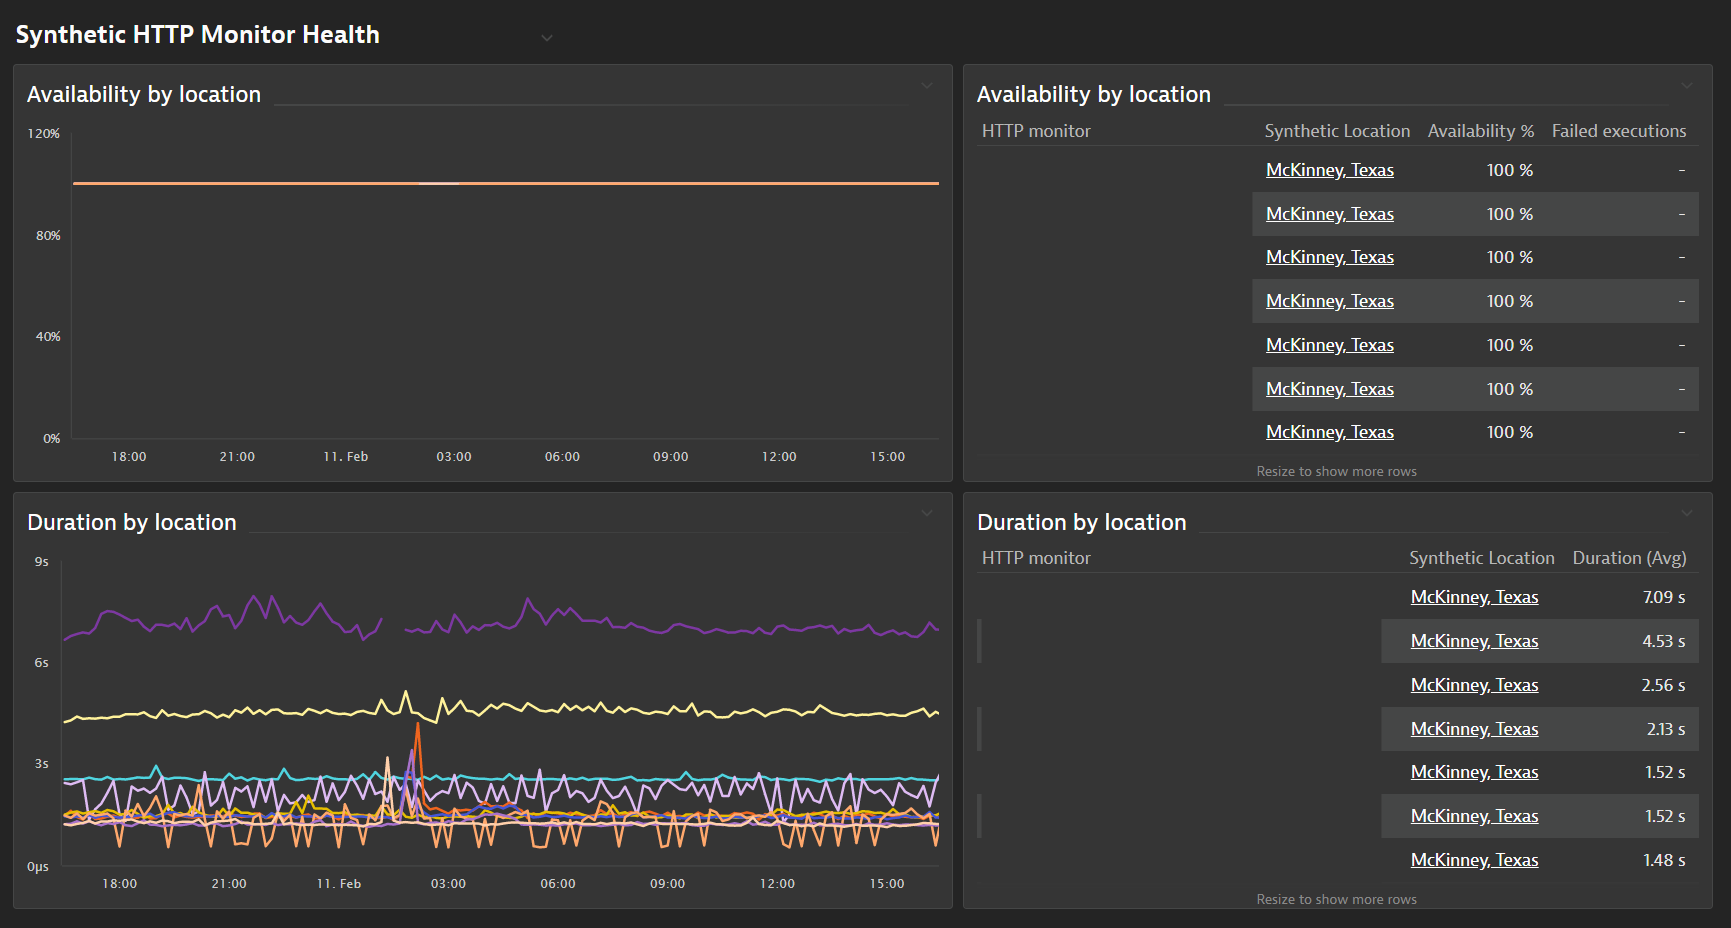
This repository contains JSON files used to populate dashboards via API call or manual import. To import a dashboard via the UI, navigate to the 'Dashboards' page in your Dynatrace tenant and select 'Import Dashboard'. Management Zones are the recommended approach for filtering.
Dynatrace Dashboard API Docs: https://www.dynatrace.com/support/help/shortlink/api-config-dashboards
Dynatrace Data Explorer Docs: https://www.dynatrace.com/support/help/shortlink/explorer
A high-level monitoring dashboard containing a variety of commonly used metrics.
Identical to Monitoring Overview, with the addition of synthetic HTTP monitor information
Identical to Monitoring Overview, with a non-operational focus on PaaS application health (i.e. no Host Health)
Identical to PaaS Application Overview, with the addition of synthetic HTTP monitor information
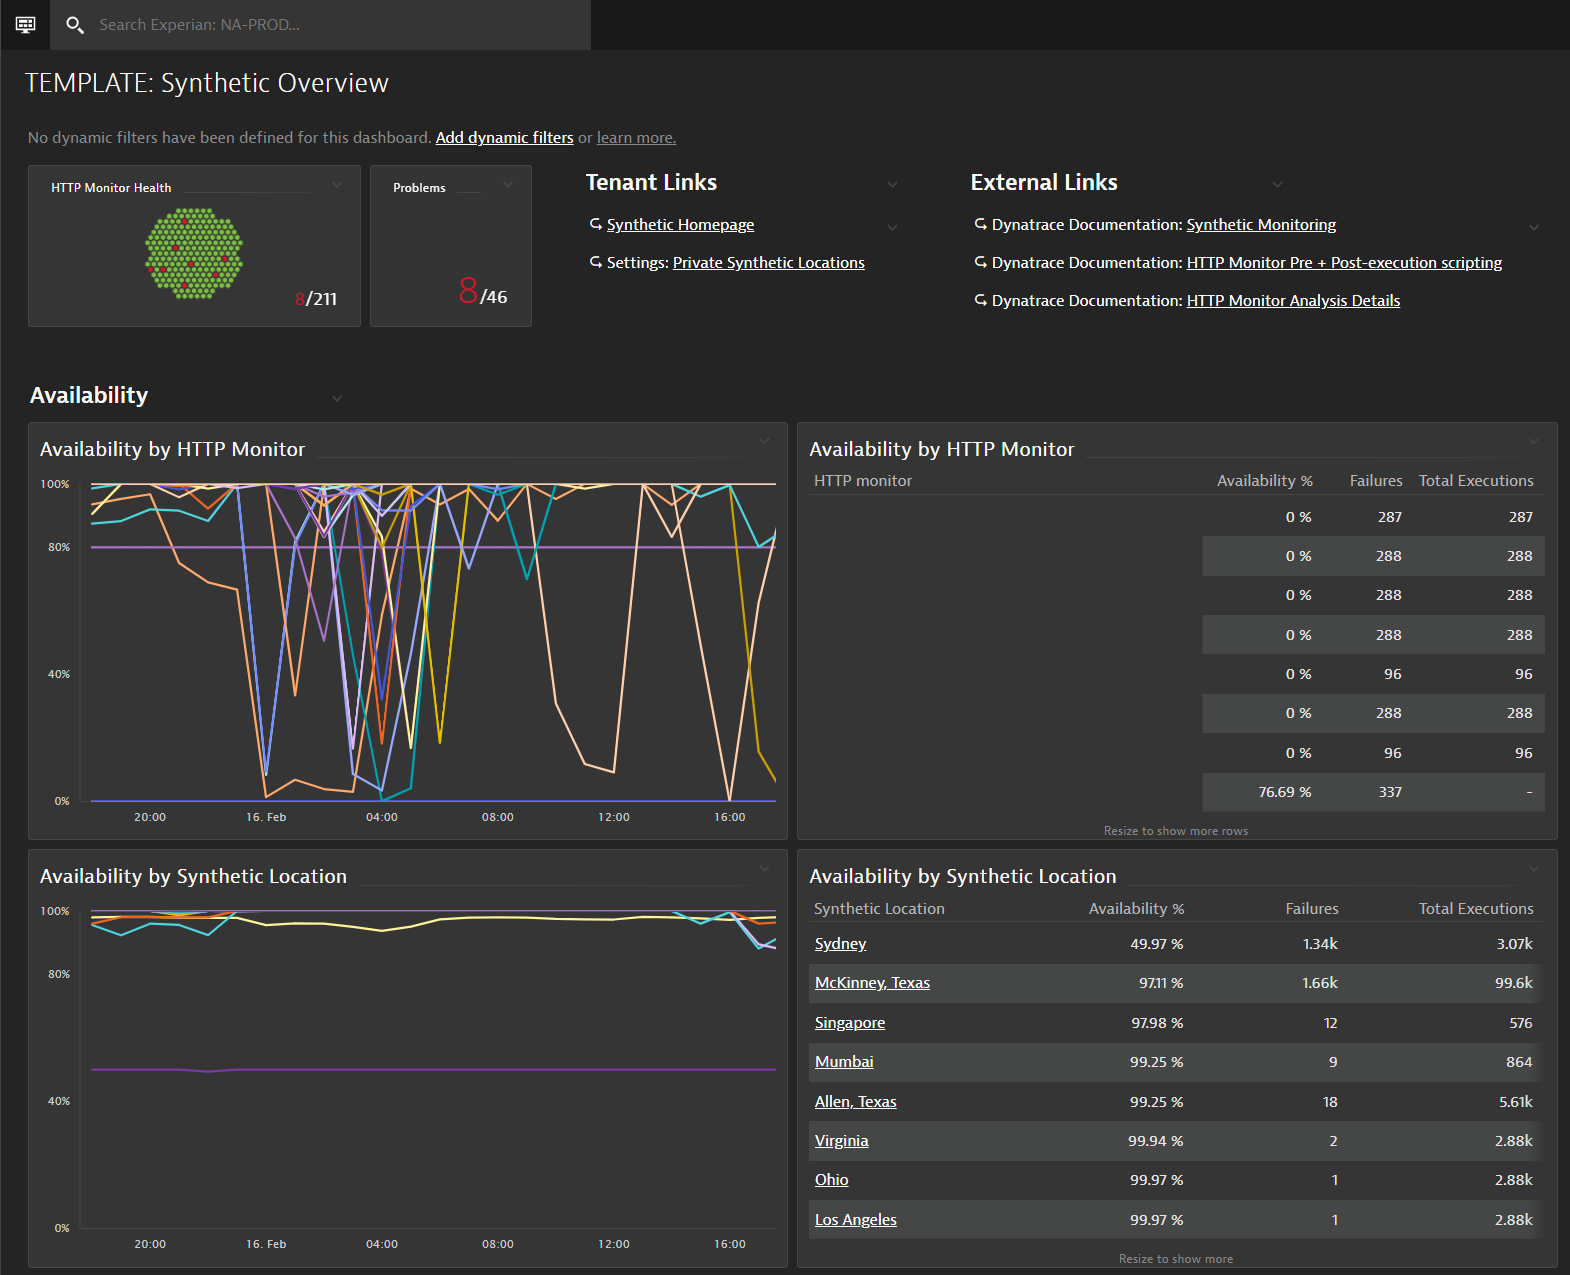
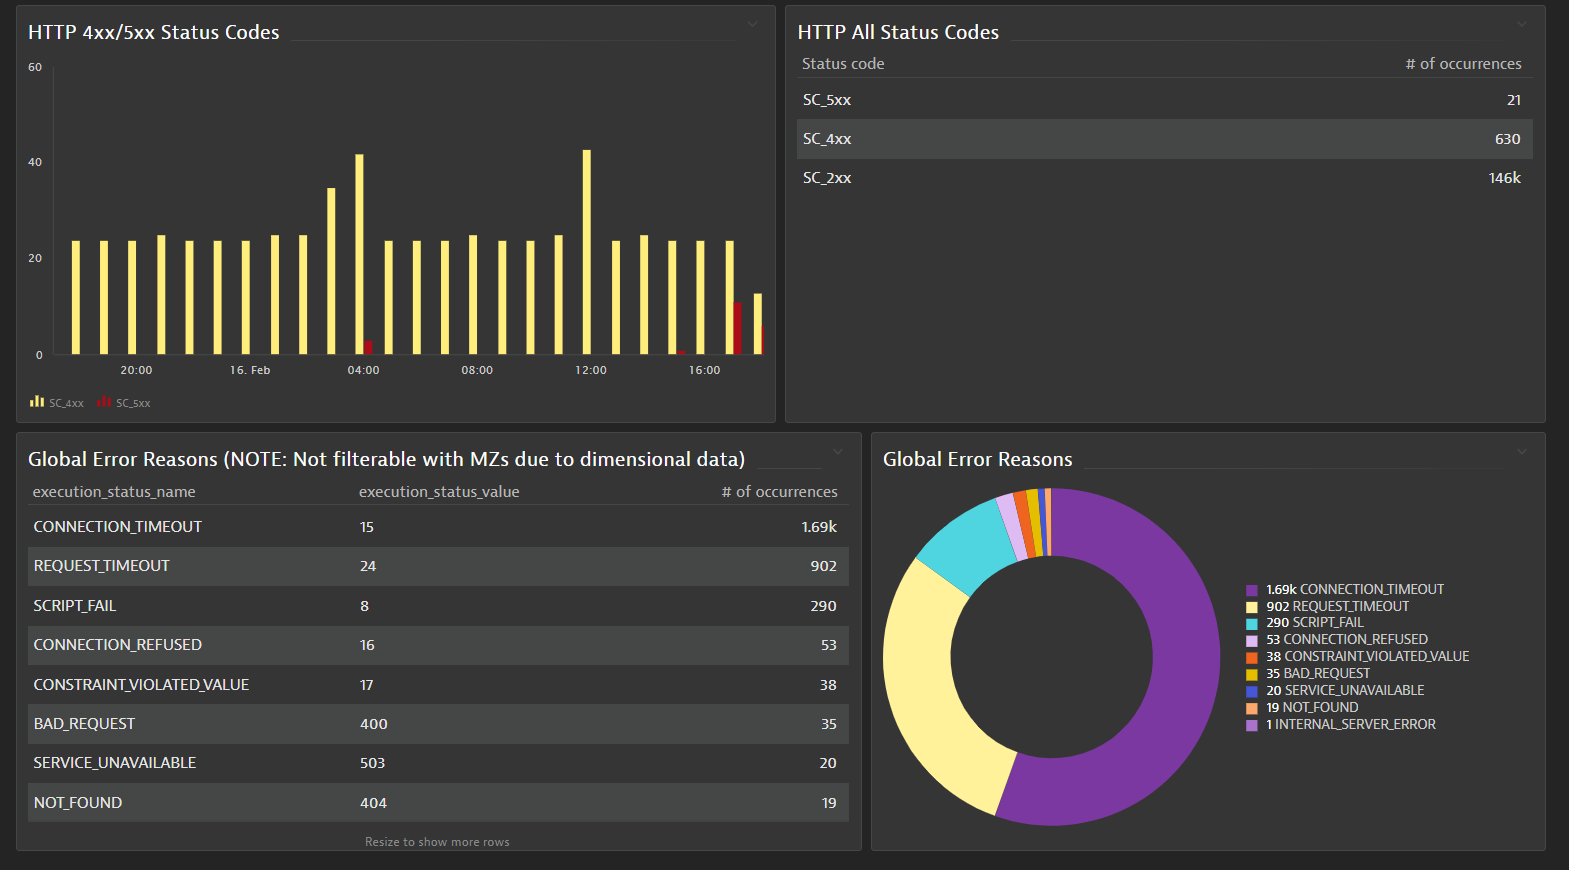
Summary of HTTP monitor health, featuring standard availability and response time metrics
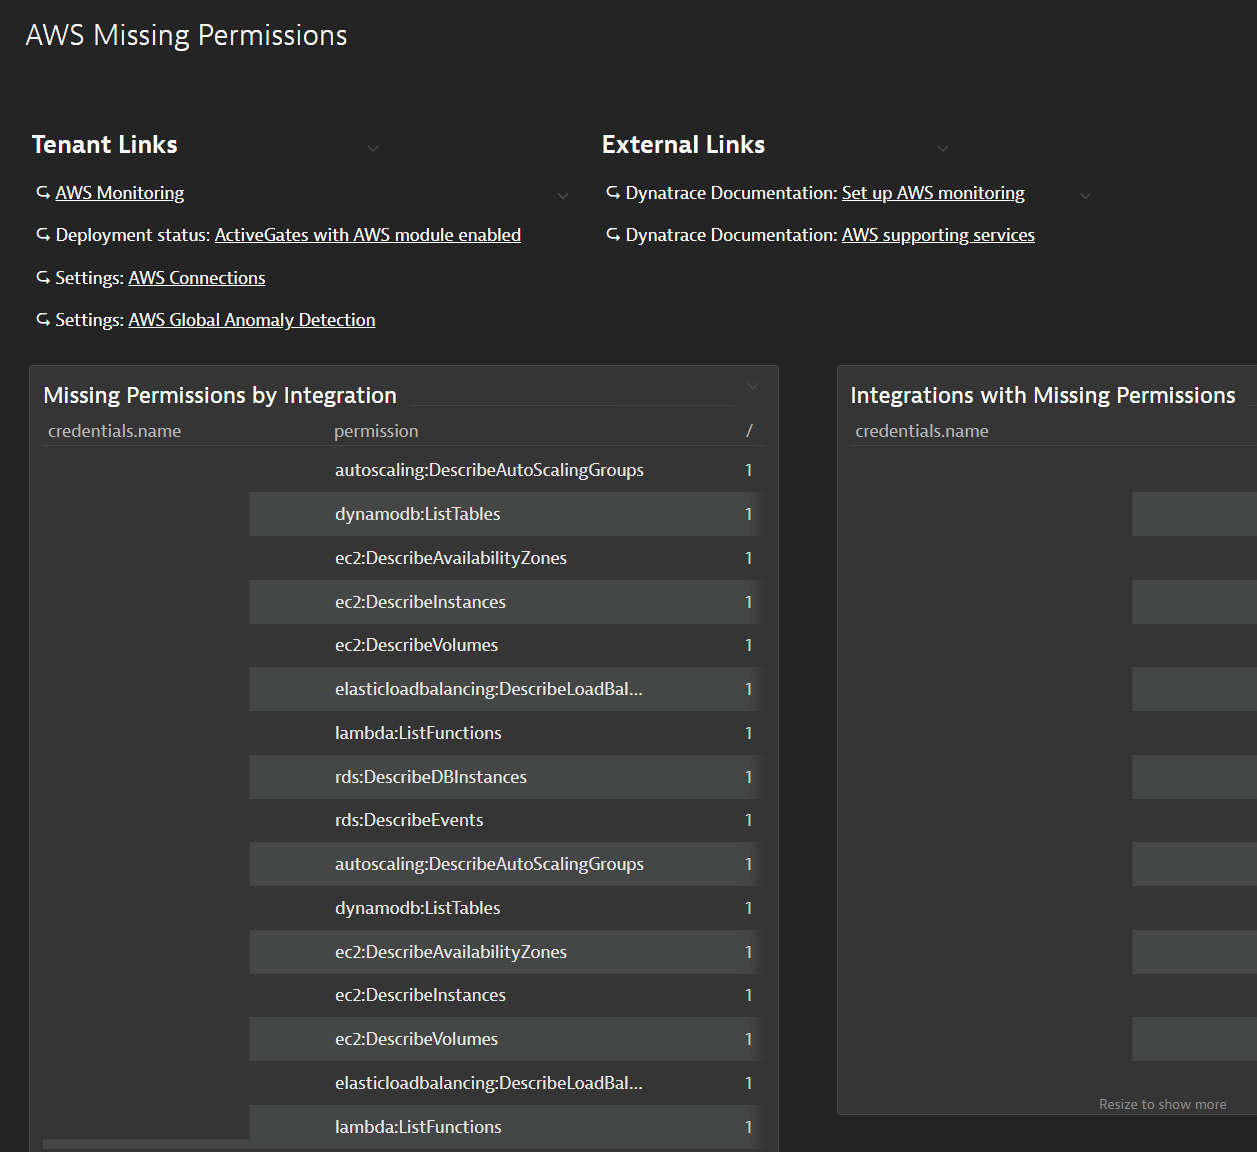
Summary of Missing AWS Permissions that may prevent metric capture by Dynatrace. Use to...
- identify any integrations/credentials that have missing data
- identify missing permissions for a particular account
- validate that accounts have the appropriate permission level
- track any new missing permissions due to changes within AWS, or if new permissions are required for monitoring purposes
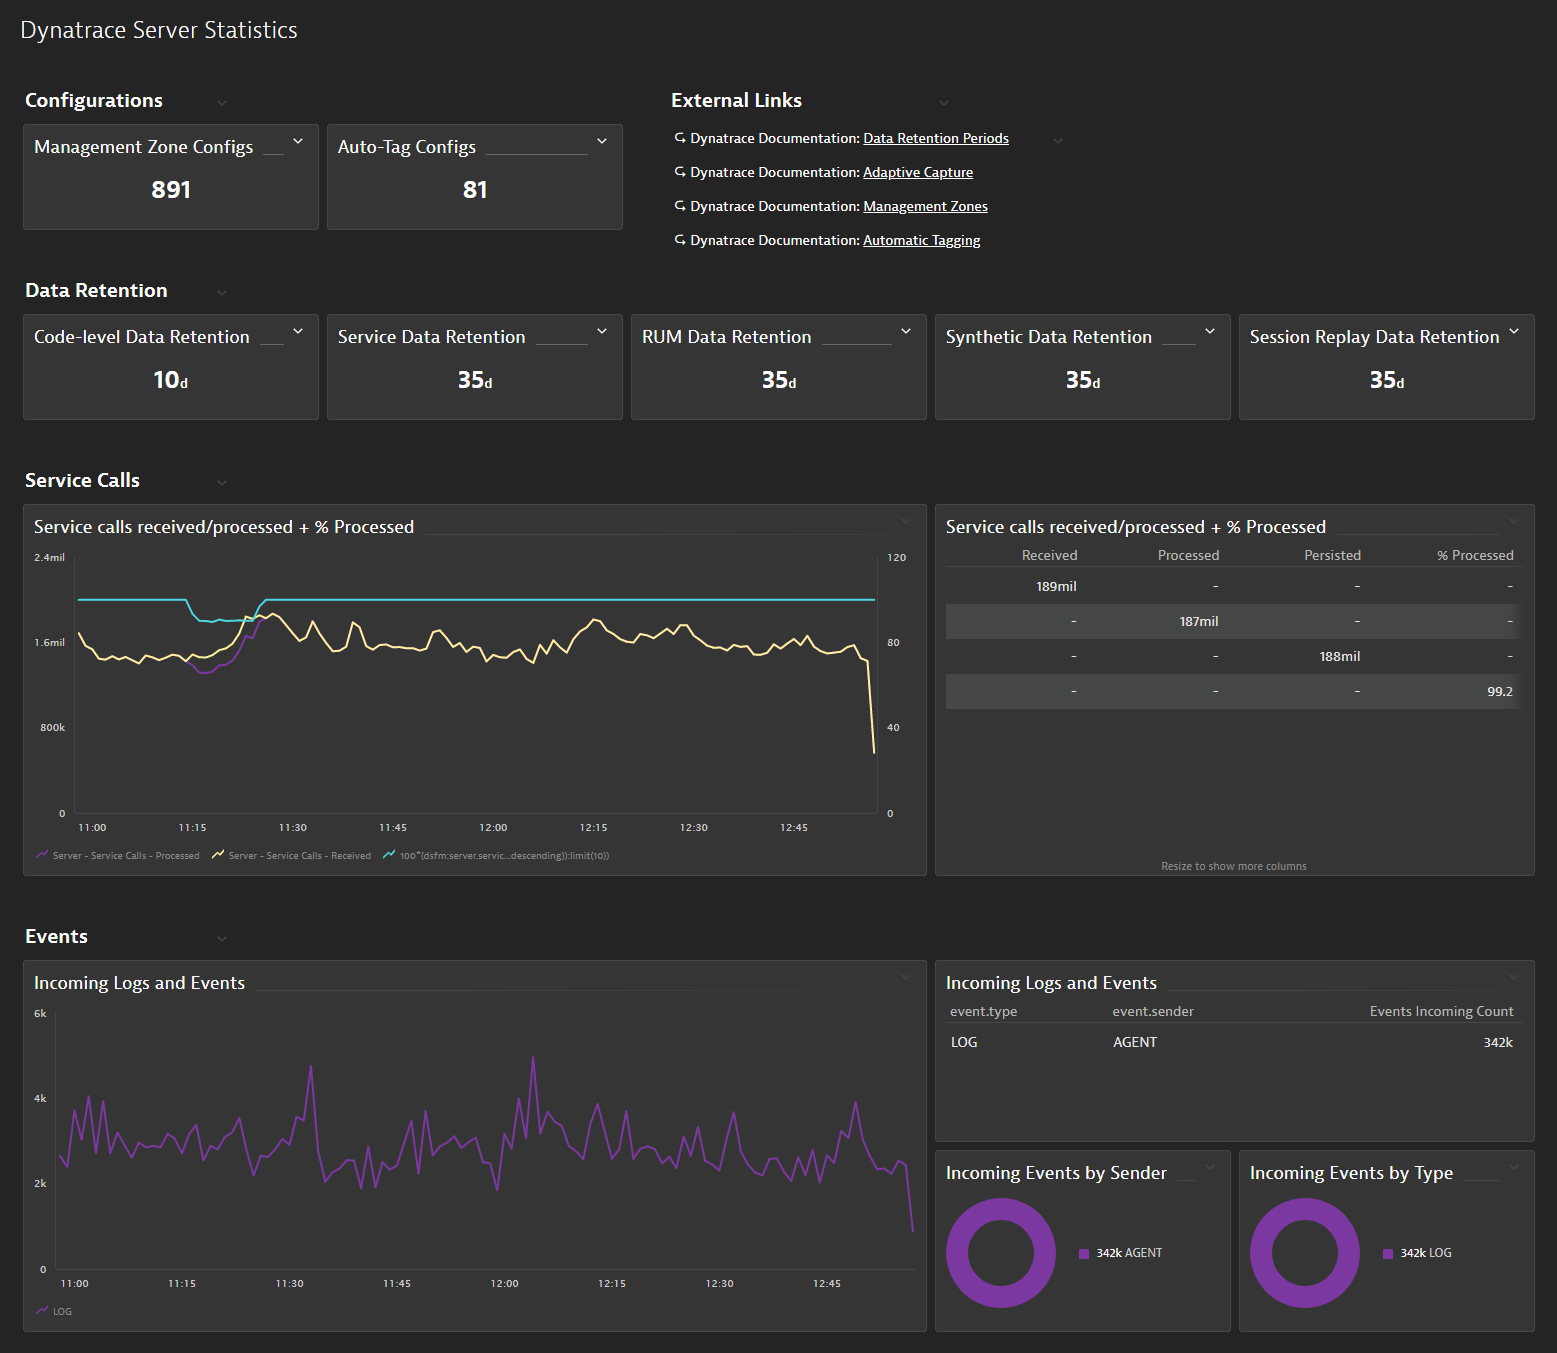
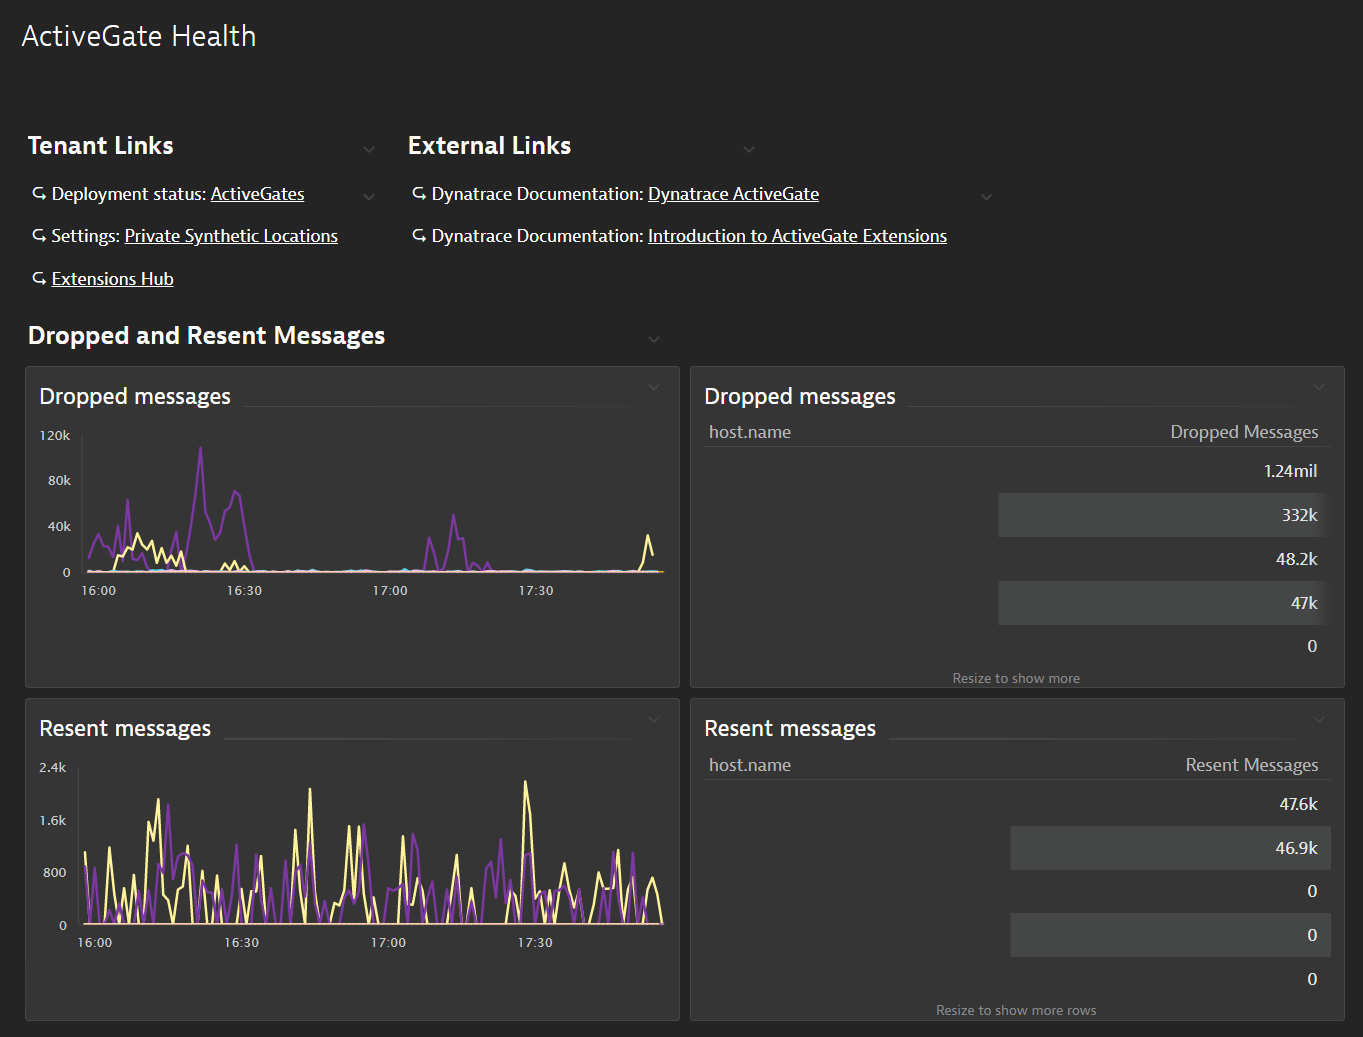
Summary of ActiveGate health, including messages dropped/recieved, Network statistics, JVM/System CPU + Memory usage, and Extension/Synthetic engine health.


