This repository contains a simple geolocation api microservice, fast, reliable, Kubernetes friendly and ready written in go as a proof of concept.
Study the feasibility of having a geolocation REST API microservice running alongside our other microservices in Kubernetes to avoid relying on the Cloudfront-Viewer-Country http headers.
The requirements are:
- Reliability
- Fast
- Concurrent
geolocation-go is written in Go, a fery fast and performant garbaged collected and concurrent programming language.
It expose a simple GET /rest/v1/{ip} REST endpoint.
Parameter:
/rest/v1/{ip}(string) - IPv4
Response:
{"ip":"88.74.7.1","country_code":"DE","country_name":"Germany","city":"Düsseldorf","latitude":51.2217,"longitude":6.77616}
To retrieve the country code and country name of the given IP address, geolocation-go use the ip-api.com real-time Geolocation API, and then cache it in-memory and in Redis for later fast retrievals.
                                                                                (2)
                                                                         +--------------> In-memory cache lookup
                                                                         |                       ^
                                                                         |                       *
                                              +------------------------+ |                       *
+-------------+            (1)                |                        | |                       * Update in-memory cache
|             |   GET /rest/v1/{ip}           |                        | |                       *
|             +------------------------------>|                        | |      (3)              v
|   Client    |                               |     geolocation-go     | +--------------> Redis lookup (optional)
|             |          (5)                  |                        | |                       ^
|             |<------------------------------+                        | |                       *
+-------------+       200 - OK                |                        | |                       * Update Redis cache
                                              +------------------------+ |                       *
                                                                         |                       *
                                                                         |      (4)              v
                                                                         +--------------> http://ip-api.com/json/{ip} lookup (optional)
-
Client make an HTTP request to
/rest/v1/{ip} -
geolocation-gowill lookup for in his in-memory datastore and send the response if cache HIT. In case of cache MISS, go to step 3) -
geolocation-gowill lookup in Redis, send the response if cache HIT and add the response in his in-memory datastore asynchronously. In case of cache MISS, go to step 4) -
geolocation-gowill make an HTTP call to the ip-api.com API, send back the response to the client and add the response to Redis and the in-memory datastore asynchronously.
geolocation-go is a 12-factor app using Viper as a configuration manager. It can read configuration from environment variables or from .env files.
-
APP_ADDR(default value::8080). Define the TCP address for the server to listen on, in the form "host:port". -
APP_CONFIG_NAME(default value:.env). Name of the configuration file to read from. -
APP_CONFIG_PATH(default value:.). Directory containing the configuration file to read from. -
SERVER_READ_TIMEOUT(default value:30s). Maximum duration for reading the entire request, including the body (ReadTimeout). -
SERVER_READ_HEADER_TIMEOUT(default value:10s). Amount of time allowed to read request headers (ReadHeaderTimeout). -
SERVER_WRITE_TIMEOUT(default value:30s). Maximum duration before timing out writes of the response (WriteTimeout). -
LOGGER_LOG_LEVEL(default value:info). Logger log level. Available values are "trace", "debug", "info", "warn", "error", "fatal", "panic" ref -
LOGGER_DURATION_FIELD_UNIT(default value:ms). Set the logger unit fortime.Durationtype fields. Available values are "ms", "millisecond", "s", "second". -
LOGGER_FORMAT(default value:json). Set the logger format. Available values are "json", "console". -
PROMETHEUS(default value:true). Enable publishing Prometheus metrics. -
PROMETHEUS_PATH(default value:/metrics). Metrics handler path. -
REDIS_CONNECTION_STRING(default valueredis://localhost:6379). Connection string to connect to Redis. The format is the following:"redis://<user>:<pass>@<host>:<port>/<db>". -
REDIS_KEY_TTL(default24h). TTL of a redis key: Time before the key saved in redis will expire. -
GEOLOCATION_API(default valueip-api). Define which geolocation API to use to retrieve geo IP information. Available options are: -
IP_API_BASE_URL(default value:http://ip-api.com/json/). Base URL for theip-apiAPI. Note that https is not available with the free plan. -
HTTP_CLIENT_TIMEOUT(default value:15s). Timeout value for the http client. -
PPROF(default value:false). Enable the pprof server. When enable,pprofis available athttp://127.0.0.1:6060/debug/pprof
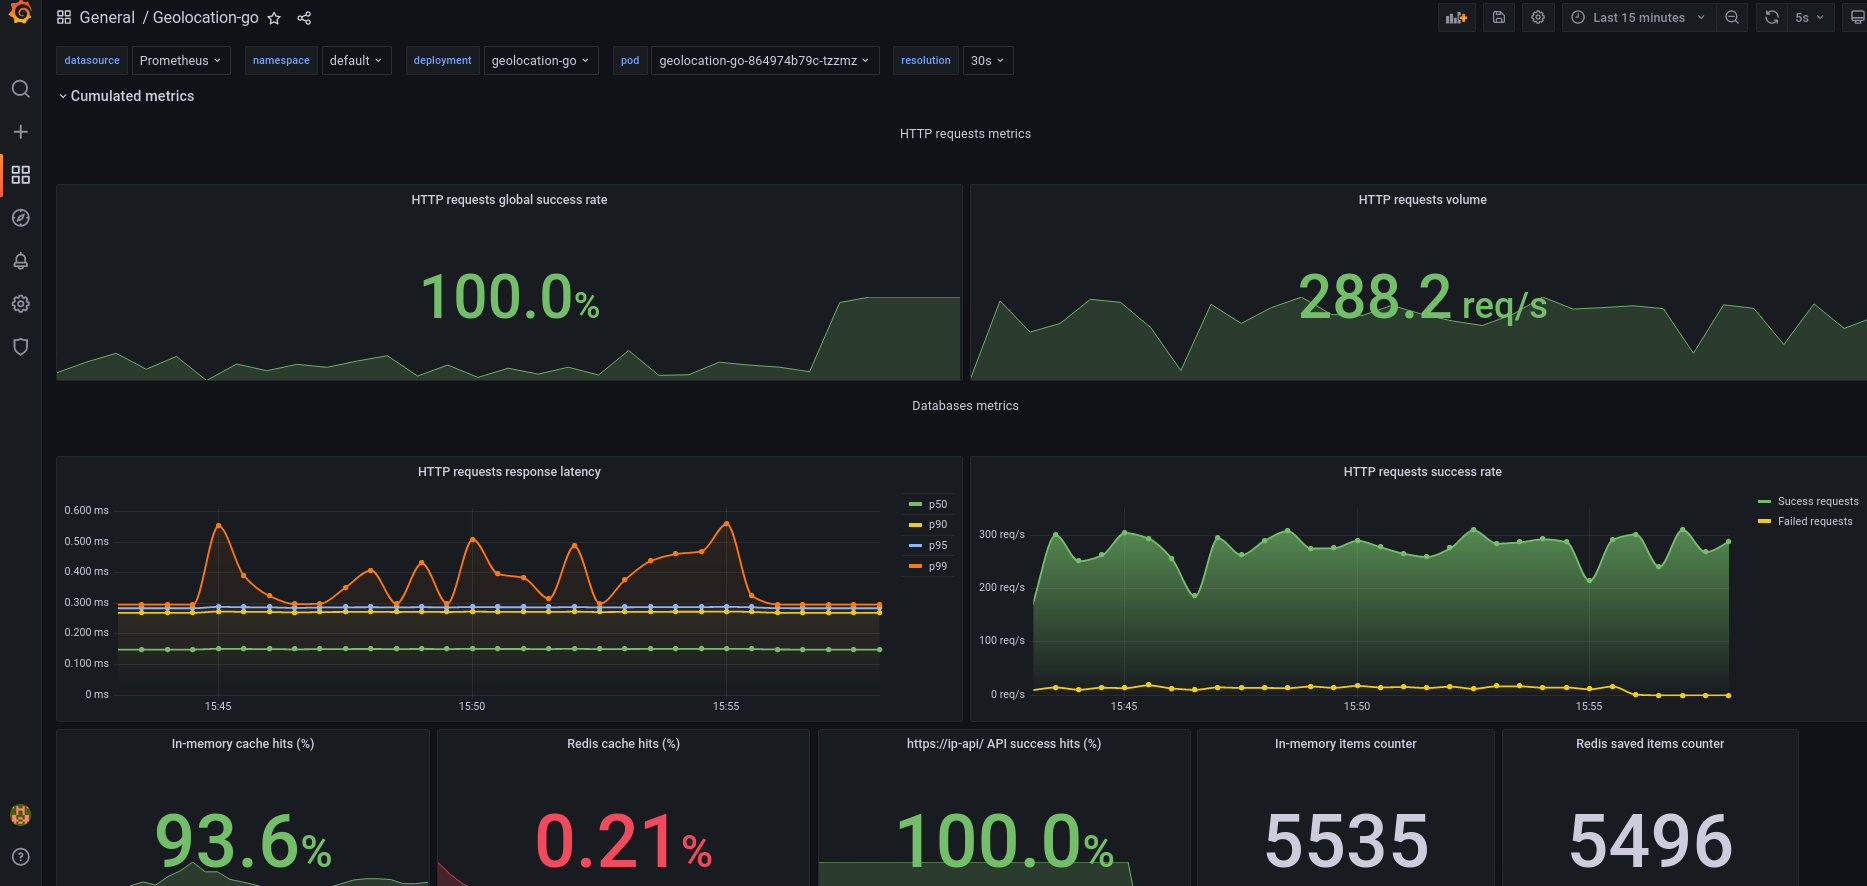
geolocation-go provides Prometheus metrics and comes with a Grafana dashboard located in deploy/grafana/dashboard.json.
Installation with kube-prometheus-stack
Install kube-prometheus-stack in your Kubernetes cluster:
# Add helm repository
helm repo add prometheus-community https://prometheus-community.github.io/helm-charts
helm repo update

# Install the Prometheus operator and the kube-prometheus-stack
helm install \
       prometheus-operator \
       prometheus-community/kube-prometheus-stack \
       --create-namespace \
       --namespace monitoring

# Access the Grafana web interface through http://localhost:8080/ (default credentials: admin/prom-operator)
kubectl port-forward -n monitoring svc/prometheus-operator-grafana 8080:3000
To install the dashboard, go to "Menu" > "Create" > "Import" > "Upload json file" and upload deploy/grafana/dashboard.json.
Click to expand
-
404 and 405 custom handler
-
Provide APM & tracing
-
Provide a Swagger endpoint
-
Support graceful shutdowns for interrupt signals (SIGTERM)