Gregory Way 2019
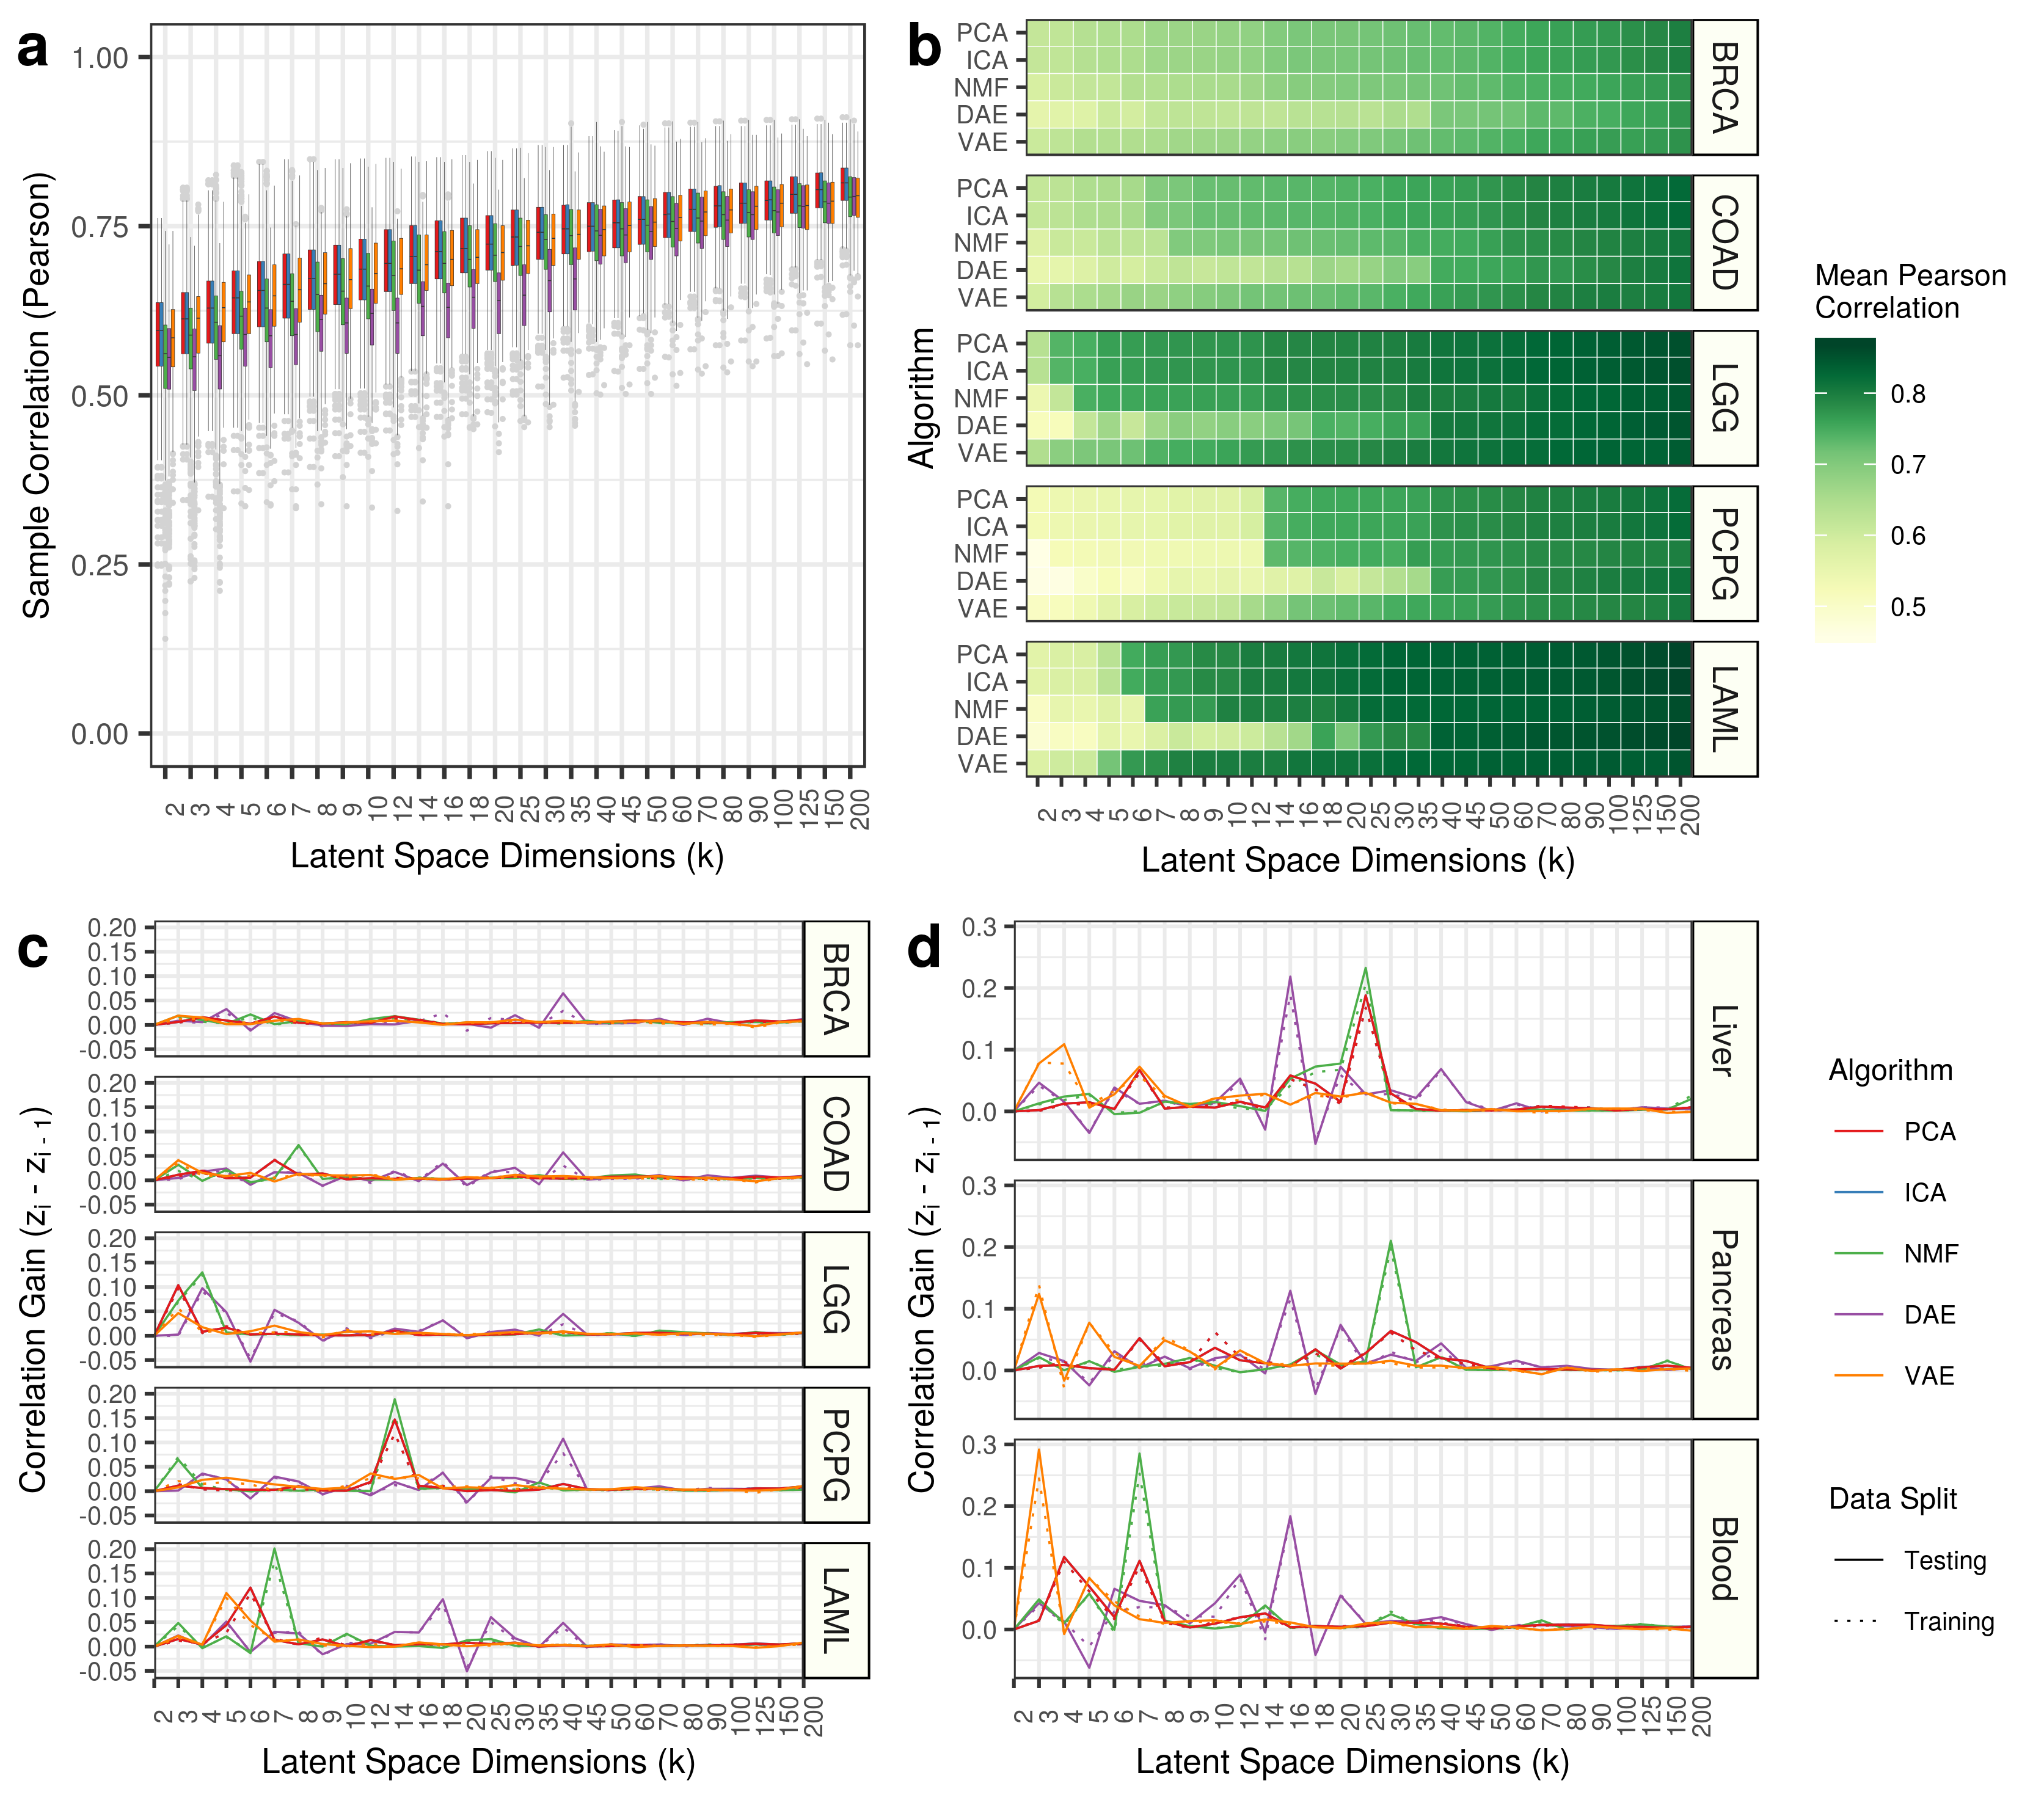
Previously, we recognized a sharp increase in the ability of variational autoencoders (VAEs) to capture the correlational structure of blood between k = 2 and k = 3. This increase in model capacity by one, increases the mean correlation of samples by nearly 0.3. We do not observe this pattern for other algorithms at this change in dimension.
We do, however, also notice large improvements in other algorithms, but at other dimensions. For example, we observe a large increase in blood correlation for PCA and ICA between 3 and 4, for NMF between 6 and 7, and, surprisingly, a large decrease in performance for DAE between 8 and 9. We chose to explore the correlational change for VAE models because there are fewer features to interrogate. See panel D below:
The samples are processed and scores applied in 0.process-gtex-blood-vae-feature.ipynb.
The relationship of these initial VAE features are visualized in 1.visualize-gtex-blood-interpretation.ipynb.
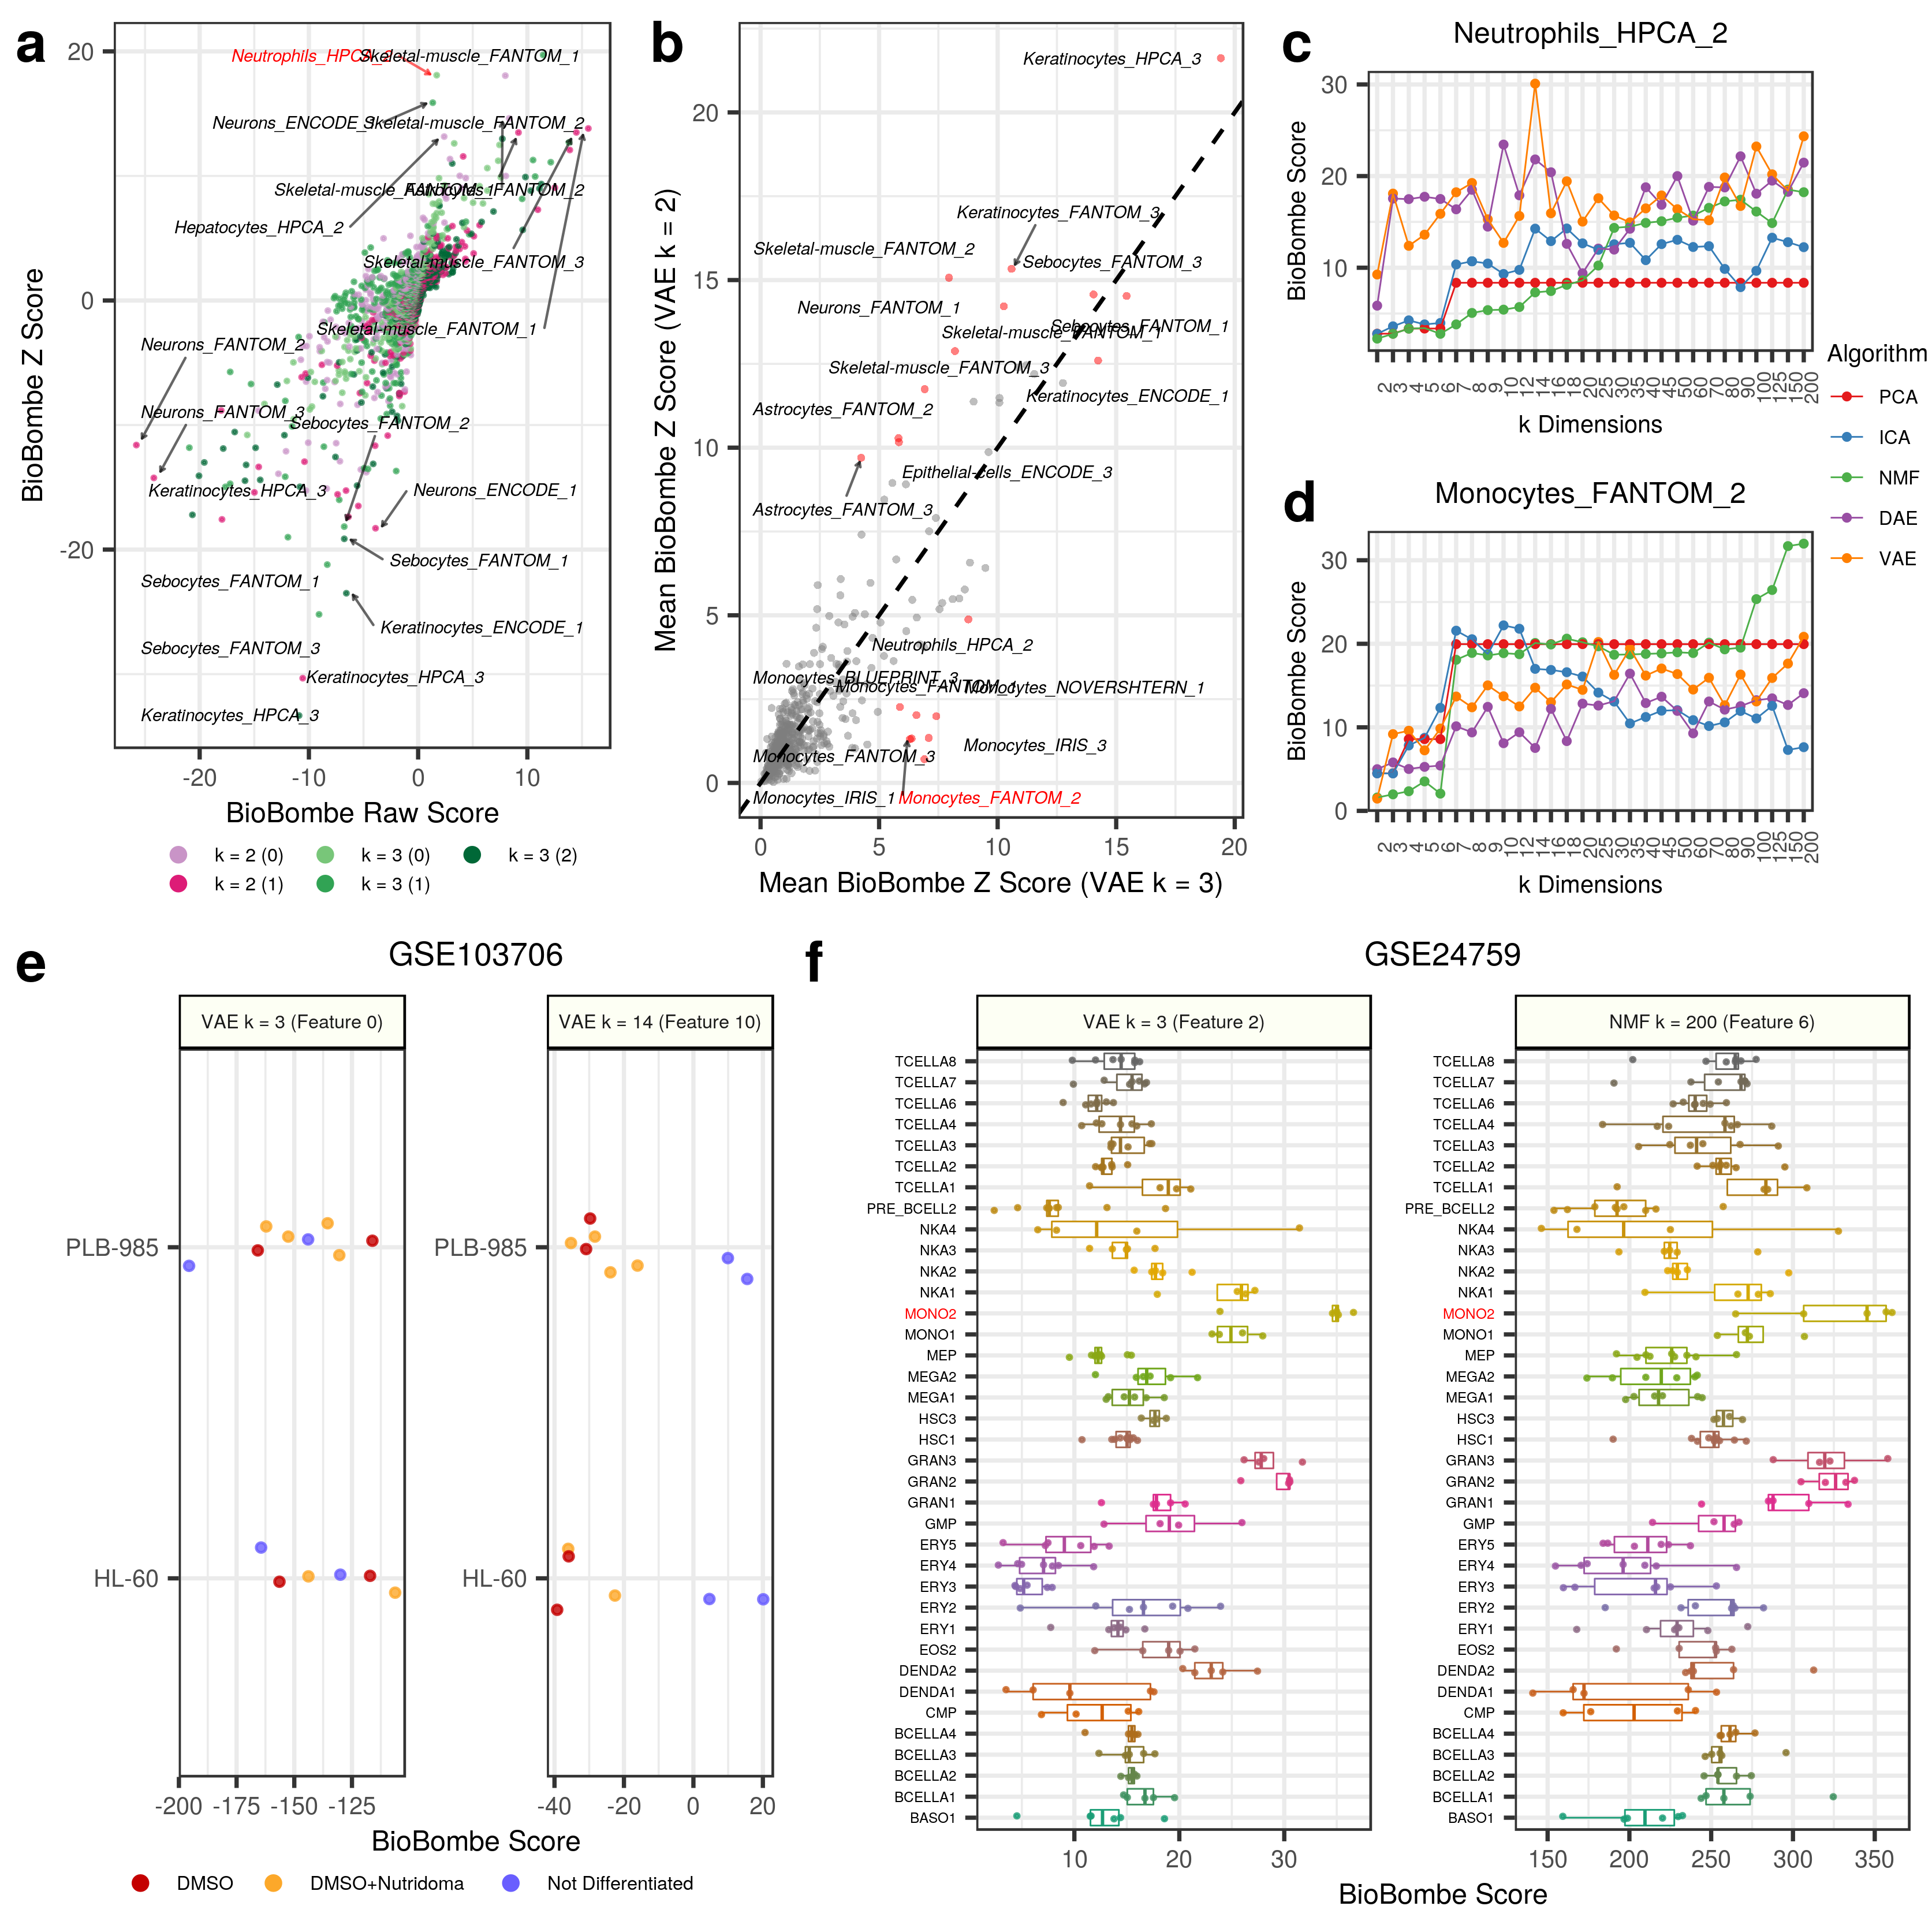
We applied our network projection approach to two VAE models (k = 2 and k = 3) using a network built from xCell gene sets. Many cell-type signatures were implicated in both VAE models including skeletal muscle, neurons, keratinocytes, and sebocytes. However, a neutrophil signature was extracted from the VAE k = 3 model and not the VAE k = 2 model (Panel A Below).
Furthermore, if we take the mean of all gene sets across all features in both models, we can identify additional gene set signatures which may also be contributing to the full model performance.
Using the approach, we implicate many of the same cell-type signatures, but we also unveil a set of monocyte signatures that are more enriched in VAE k = 3 than k = 2.
The signature Monocytes_FANTOM_2 appears to have the lowest enrichment in VAE k = 2 and a relatively high enrichment in k = 3 (Panel B Below).
Therefore, we elected to follow up with two features implicated in the VAE model k = 3 that may be helping with the sharp increase in correlation in blood tissues with a single increase in model capacity.
The gene sets we chose to follow up with are Neutrophils_HPCA_2 and Monocytes_FANTOM_2.
Each algorithm at all dimensions received a score for all xCell gene sets.
We tracked this score and can visualize the enrichment as k increases for Neutrophils_HPCA_2 (Panel C Above) and Monocytes_FANTOM_2 (Panel D Above).
Evidently, the scores seem to improve for all algorithms as the dimensions increase, but there are spikes at intermediate dimensions.
The feature with the highest scoring Neutrophils_HPCA_2 gene set was feature 10 in VAE k = 14.
The feature with the highest scoring Monocytes_FANTOM_2 gene set was feature 6 in NMF k = 200.
We selected the top scoring feature for both gene sets and applied these (along with the origin k = 3 high scoring features) to external datasets.
We downloaded processed gene expression data from GSE103706 (Rincon et al. 2018).
In this dataset there are two acute myeloid leukemia (AML) cell lines; PLB-985 and HL-60, and a total of 14 samples. The cell lines are exposed to two treatments - DMSO and DMSO+Nutridoma - plus replicates with no treatment applied. The treatments are demonstrated to induce neutrophil differentiation in these cell lines.
We hypothesized that our constructed feature identified through our interpret compression approach would have higher activation patterns in the cell lines with induced neutrophil differentiation.
The data is downloaded and processed in 2A.download-neutrophil-data.ipynb.
We downloaded processed gene expression data from GSE24759 (Novershtern et al. 2011).
In this dataset there are 211 samples consisting of 38 distinct hematopoietic states in various stages of differentiation.
We hypothesized that our constructed feature identified through our interpret compression approach would have higher activation patterns in Monocytes.
The data is downloaded and processed in 2B.download-hematopoietic-data.ipynb.
The BioBombe derived compression signatures are applied to the external datasets in 3.apply-signatures.ipynb.
The two VAE features (feature 0 in VAE k = 3 and feature 10 in VAE k = 14) were applied to GSE103706 (Panel E Above). Feature 0 from VAE k = 3 and feature 10 from VAE k = 14 had the highest scores for the specific neutrophil gene set. It does not appear that the k = 3 feature was able to robustly separate the the two treatments from the untreated cell line controls. However, the untreated controls were tending towards negative scores. The k = 14 feature perfectly separated the untreated cell lines from the treated cell lines and therefore validate the interpretation approach.
The two features (feature 2 in VAE k = 3 and feature 200 in NMF k = 200) were applied to GSE24759 (Panel F Above).
Both features showed the highest scores in isolated monocytes.
Indeed, it appears that, specifically, Mono2 cells were particularly enriched.
Granulocytes also had high scores along this axis, indicating similarity between specific hematopoietic differentiation stages.
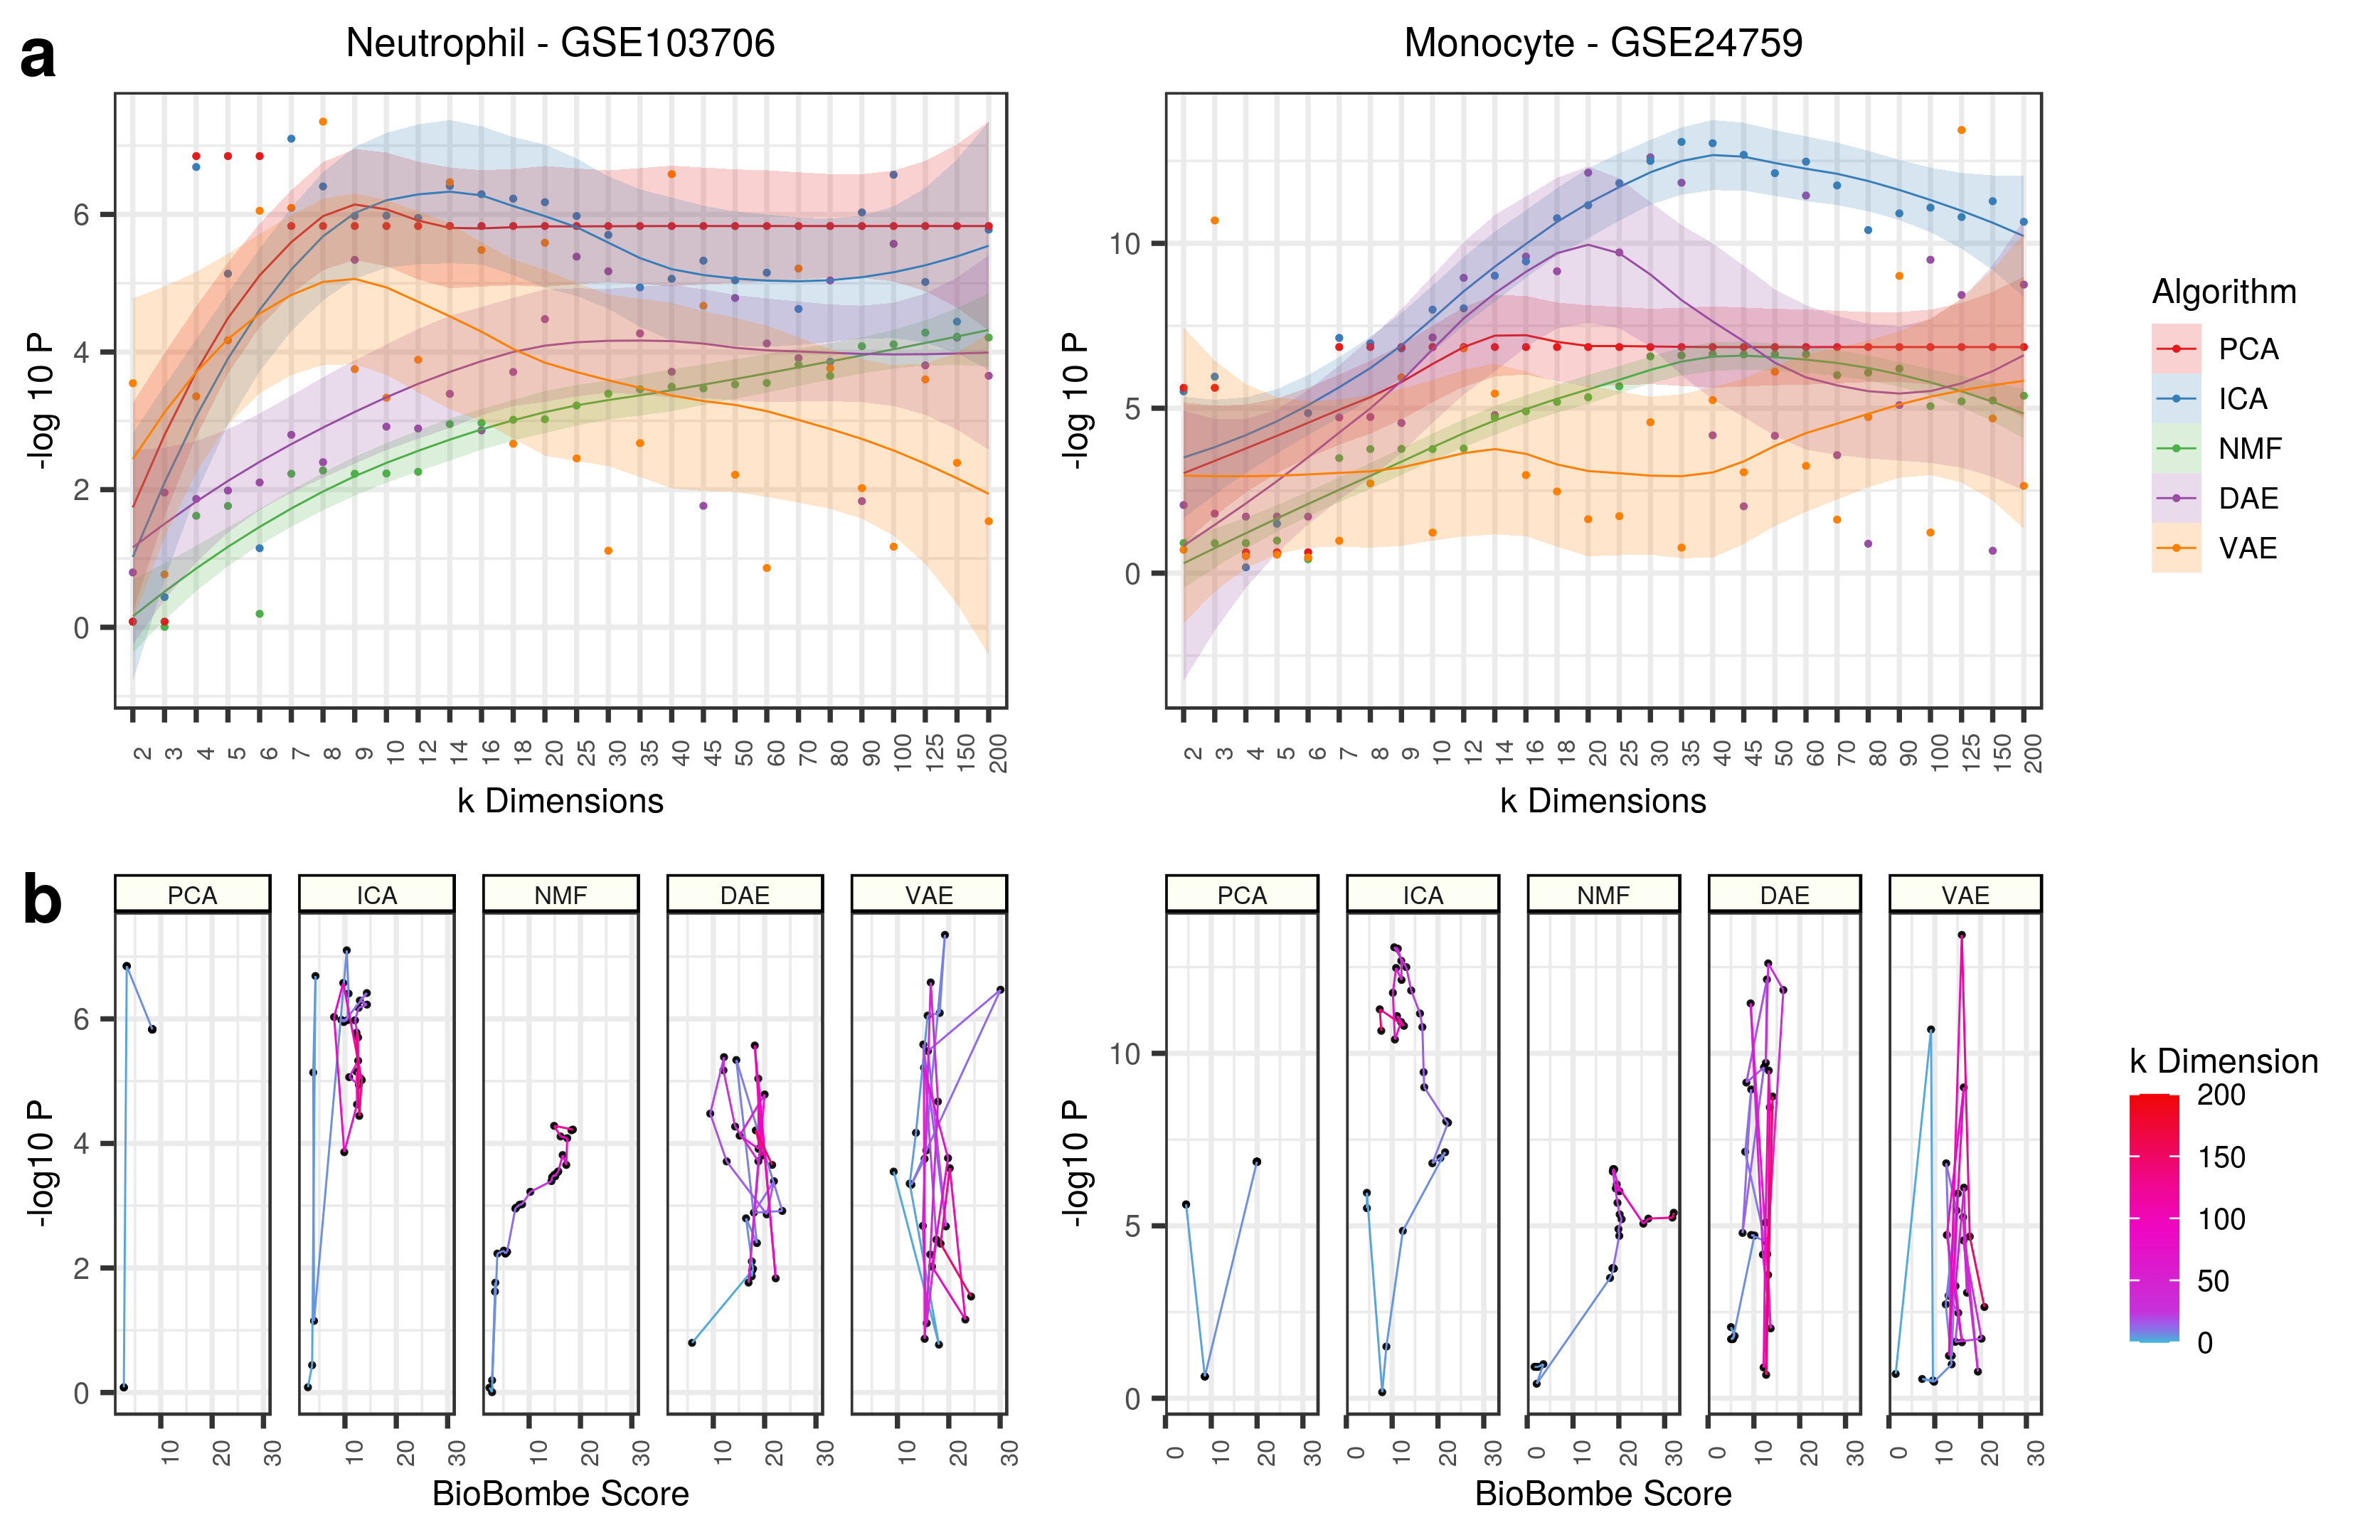
Applying all top features (for both Neutrophil and Monocyte signatures) to each data sets also identifies various signals across latent dimensionalities, but this does not correlate strongly to BioBombe z scores.
To reproduce the results of the GTEx analysis perform the following:
# Activate computational environment
conda activate biobombe

# Perform the analysis
cd 8.gtex-interpret
./gtex_analysis.sh


