-
Notifications
You must be signed in to change notification settings - Fork 26
New issue
Have a question about this project? Sign up for a free GitHub account to open an issue and contact its maintainers and the community.
By clicking “Sign up for GitHub”, you agree to our terms of service and privacy statement. We’ll occasionally send you account related emails.
Already on GitHub? Sign in to your account
Occasional metric loss and hangs in DCGM Exporter #38
Comments
|
I noted this as well, and found that my dcgm pod was being repeatedly killed by the liveness probe. When I removed that, it started getting OOM killed instead. Mind boggling to me that it uses over 128MiB steady state (on my cluster, at least). Not worth that much overhead just to get GPU usage metrics. |
Use over 300MiB on my cluster. As a workaround, Ops system on my cluster will try to restart dcgm pod after monitoring gpu metric hang for 5min. |
Yikes. I believe it. Saw my usage steadily climbing the whole time it was up. We use dedicated nodes at my work (i.e. scheduled pods take up essentially the whole node) so sacrificing that much RAM for metrics is out of the question, even if it didn't require constant restarts. |
I encountered a problem with DCGM Exporter where metrics occasionally go missing or hang. I have noticed that this issue does not occur consistently but happens intermittently, causing difficulties in monitoring and data analysis.
Environment Information
Expected Behavior
I expected DCGM Exporter to consistently collect and export metric data according to the configuration, without experiencing occasional loss and hangs.
Actual Behavior
All GPU metrics suddenly hang.

dcgm-exporter metrics lost gpu2 util metric.

no weired logs for dcgm-exporter and no kernel issues at that point.

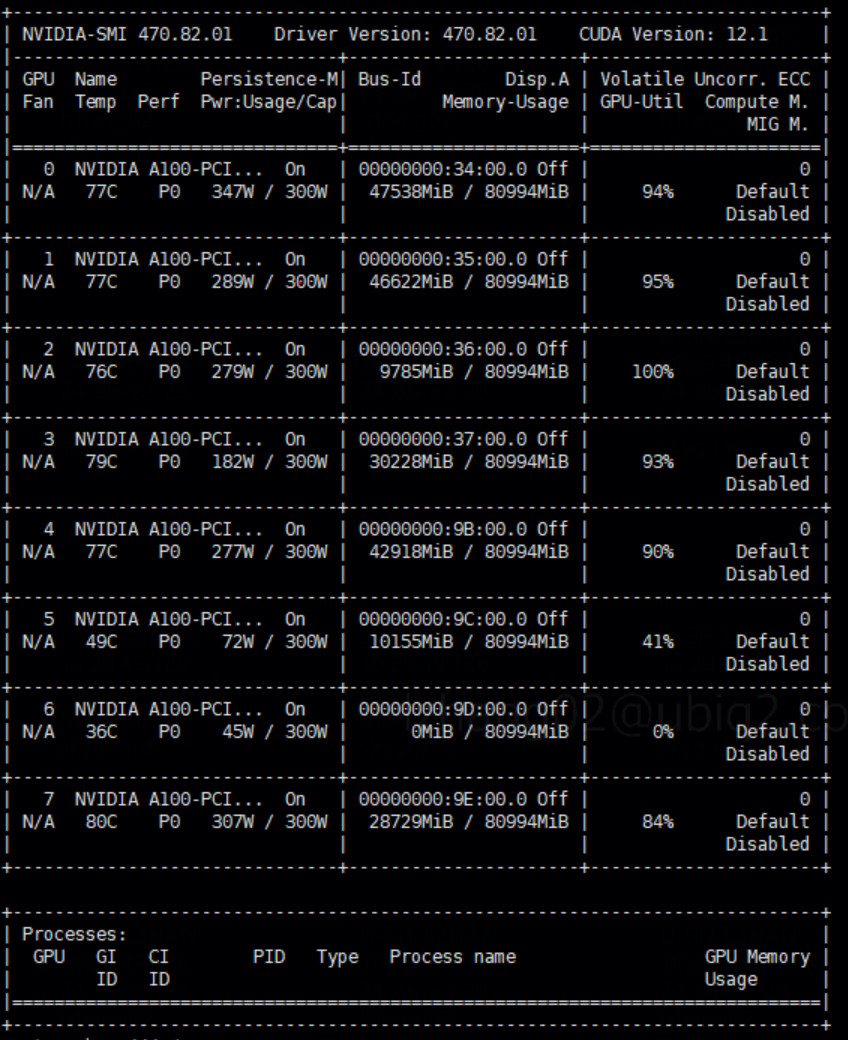
nvidia-smi can display real statistic.

After restart dcgm-exporter pod, everything works fine.
Guess
After read some code about dcgm-exporter which call go-dcgm to fetch gpu metrics, I think there has some wrong with the go-exporter.
Please investigate this issue and provide support and guidance. Thank you!
The text was updated successfully, but these errors were encountered: